US Cellular 2015 Annual Report Download - page 38
Download and view the complete annual report
Please find page 38 of the 2015 US Cellular annual report below. You can navigate through the pages in the report by either clicking on the pages listed below, or by using the keyword search tool below to find specific information within the annual report.-
 1
1 -
2
-
3
-
4
-
5
-
6
-
7
-
8
-
9
-
10
-
11
-
12
-
13
-
14
-
15
-
16
-
17
-
18
-
19
-
20
-
21
-
22
-
23
-
24
-
25
-
26
-
27
-
 28
28 -
 29
29 -
 30
30 -
 31
31 -
 32
32 -
 33
33 -
 34
34 -
 35
35 -
 36
36 -
 37
37 -
 38
38 -
 39
39 -
 40
40 -
 41
41 -
 42
42 -
 43
43 -
 44
44 -
 45
45 -
 46
46 -
 47
47 -
 48
48 -
49
-
50
-
51
-
52
-
53
-
54
-
55
-
56
-
57
-
58
-
59
-
60
-
61
-
62
-
63
-
64
-
65
-
66
-
67
-
68
-
69
-
70
-
71
-
72
-
73
-
74
-
75
-
76
-
77
-
78
-
79
-
80
-
81
-
82
-
83
-
84
-
85
-
86
-
87
-
88
-
89
-
90
-
91
-
92
-
93
-
94
-
95
-
96
-
97
-
98
-
99
-
100
-
101
-
102
-
103
-
104
-
105
-
106
-
107
-
108
-
109
-
110
-
111
-
112
-
113
-
114
-
115
-
116
-
117
-
118
-
119
-
120
-
121
-
122
-
123
-
124
 |
 |
12MAR201610541045
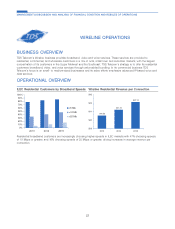
BUSINESS OVERVIEW
Under TDS Telecom’s OneNeck IT Solutions brand, TDS Telecom offers a full-suite of IT solutions ranging from
equipment resale to full management and hosting of a customer’s IT infrastructure and applications. The goal of HMS
operations is to create, deliver, and support a platform of IT products and services tailored for mid-market business
customers.
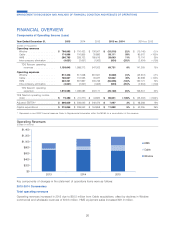
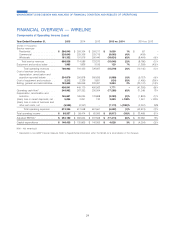
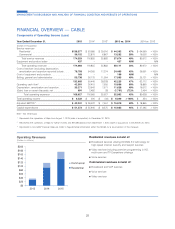
FINANCIAL OVERVIEW — HMS
Components of Operating Income (Loss)
Year Ended December 31, 2015 2014 2013 2015 vs. 2014 2014 vs. 2013
(Dollars in thousands)
Service revenues ................ $ 116,810 $ 109,766 $ 94,875 $ 7,044 6% $ 14,891 16%
Equipment and product sales ........ 169,985 148,966 90,741 21,019 14% 58,225 64%
Total operating revenues .......... 286,795 258,732 185,616 28,063 11% 73,116 39%
Cost of services (excluding depreciation,
amortization and accretion reported
below) ..................... 85,163 77,392 60,423 7,771 10% 16,969 28%
Cost of equipment and products ...... 142,927 126,362 75,991 16,565 13% 50,371 66%
Selling, general and administrative ..... 47,104 53,020 44,945 (5,916) (11)% 8,075 18%
275,194 256,774 181,359 18,420 7% 75,415 42%
Operating cash flow* .............. 11,601 1,958 4,257 9,643 >100% (2,299) (54)%
Depreciation, amortization and accretion . . 26,948 26,912 24,262 36 – 2,650 11%
Loss on impairment of assets ........ –84,000 – (84,000) N/M 84,000 N/M
(Gain) loss on asset disposals, net ..... 89 181 125 (92) (51)% 56 45%
Total operating expenses ........ 302,231 367,867 205,746 (65,636) (18)% 162,121 79%
Total operating income (loss) ......... $ (15,436) $(109,135) $ (20,130) $ 93,699 86% $ (89,005) >(100)%
Adjusted EBITDA* ............... $ 11,538 $ 1,996 $ 4,349 $ 9,542 >100% $ (2,353) (54)%
Capital expenditures .............. $ 27,059 $ 36,618 $ 16,474 $ (9,559) (26)% $ 20,144 >100%
N/M – Not meaningful
* Represents a non-GAAP financial measure. Refer to Supplemental Information within this MD&A for a reconciliation of this measure.
30
MANAGEMENT’S DISCUSSION AND ANALYSIS OF FINANCIAL CONDITION AND RESULTS OF OPERATIONS
HMS OPERATIONS