US Cellular 2015 Annual Report Download - page 15
Download and view the complete annual report
Please find page 15 of the 2015 US Cellular annual report below. You can navigate through the pages in the report by either clicking on the pages listed below, or by using the keyword search tool below to find specific information within the annual report.-
 1
1 -
2
-
3
-
4
-
 5
5 -
 6
6 -
 7
7 -
 8
8 -
 9
9 -
 10
10 -
 11
11 -
 12
12 -
 13
13 -
 14
14 -
 15
15 -
 16
16 -
 17
17 -
 18
18 -
 19
19 -
 20
20 -
 21
21 -
 22
22 -
 23
23 -
 24
24 -
 25
25 -
26
-
27
-
28
-
29
-
30
-
31
-
32
-
33
-
34
-
35
-
36
-
37
-
38
-
39
-
40
-
41
-
42
-
43
-
44
-
45
-
46
-
47
-
48
-
49
-
50
-
51
-
52
-
53
-
54
-
55
-
56
-
57
-
58
-
59
-
60
-
61
-
62
-
63
-
64
-
65
-
66
-
67
-
68
-
69
-
70
-
71
-
72
-
73
-
74
-
75
-
76
-
77
-
78
-
79
-
80
-
81
-
82
-
83
-
84
-
85
-
86
-
87
-
88
-
89
-
90
-
91
-
92
-
93
-
94
-
95
-
96
-
97
-
98
-
99
-
100
-
101
-
102
-
103
-
104
-
105
-
106
-
107
-
108
-
109
-
110
-
111
-
112
-
113
-
114
-
115
-
116
-
117
-
118
-
119
-
120
-
121
-
122
-
123
-
124
 |
 |

Gain (loss) on investments
In connection with the NY1 & NY2 Deconsolidation, TDS recognized a non-cash pre-tax gain of $14.5 million which was
recorded in Gain (loss) on investments in 2013. See Note 8 — Investments in Unconsolidated Entities in the Notes to
Consolidated Financial Statements for additional information.
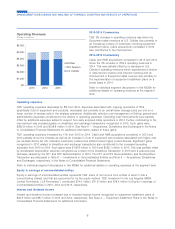
Interest expense
Interest expense increased from 2014 to 2015 due primarily to U.S. Cellular’s issuance of $275 million of 7.25% Senior
Notes in December 2014 and the $225 million Term Loan in July 2015. Interest expense increased from 2013 to 2014
due primarily to a decrease in capitalized interest related to network and systems projects.
Income tax expense
The effective tax rates on Income before income taxes and extraordinary items (‘‘pre-tax income’’) for 2015, 2014 and
2013 were 39.6%, 3.2% and 43.0%, respectively. The following significant discrete and other items impacted income tax
expense for these years:
2015 — The effective tax rate for 2015 is consistent with a normalized tax rate inclusive of federal and state tax. There
were no significant discrete items that impacted the rate.
2014 — The effective tax rate for 2014 includes tax expense of $38.5 million related to valuation allowances recorded
against certain state deferred tax assets, higher tax expense of $18.3 million due to the tax effects of a nondeductible
impairment of Goodwill, and a tax benefit of $10.8 million related to a release of valuation allowance on federal net
operating losses previously limited under loss utilization rules. The overall effective tax rate is lower due to the effect of
these items combined with the loss in 2014 in Income (loss) before income taxes.
2013 — The effective tax rate for 2013 includes tax expense of $14.9 million related to the NY1 & NY2 Deconsolidation
and the Divestiture Transaction, and a tax benefit of $5.5 million resulting from statute of limitation expirations. The NY1
and NY2 Deconsolidation and the Divestiture Transaction are discussed in Note 8 — Investments in Unconsolidated
Entities and Note 6 — Acquisitions, Divestitures and Exchanges, respectively, in the Notes to Consolidated Financial
Statements.
See Note 4 — Income Taxes in the Notes to Consolidated Financial Statements for further information on the effective
tax rate.
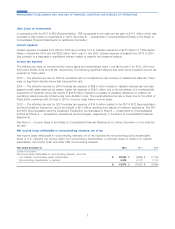
Net income (loss) attributable to noncontrolling interests, net of tax
Net income (loss) attributable to noncontrolling interests, net of tax includes the noncontrolling public shareholders’
share of U.S. Cellular’s net income (loss), the noncontrolling shareholders’ or partners’ share of certain U.S. Cellular
subsidiaries’ net income (loss) and other TDS noncontrolling interests.
Year Ended December 31, 2015 2014 2013
(Dollars in thousands)
Net income (loss) attributable to noncontrolling interests, net of tax
U.S. Cellular noncontrolling public shareholders’ ......................... $ 38,230 $ (6,826) $ 21,775
Noncontrolling shareholders’ or partners’ ............................. 5,343 (4,111) 3,119
$ 43,573 $ (10,937) $ 24,894
7
MANAGEMENT’S DISCUSSION AND ANALYSIS OF FINANCIAL CONDITION AND RESULTS OF OPERATIONS