US Cellular 2015 Annual Report Download - page 62
Download and view the complete annual report
Please find page 62 of the 2015 US Cellular annual report below. You can navigate through the pages in the report by either clicking on the pages listed below, or by using the keyword search tool below to find specific information within the annual report.-
 1
1 -
2
-
3
-
4
-
5
-
6
-
7
-
8
-
9
-
10
-
11
-
12
-
13
-
14
-
15
-
16
-
17
-
18
-
19
-
20
-
21
-
22
-
23
-
24
-
25
-
26
-
27
-
28
-
29
-
30
-
31
-
32
-
33
-
34
-
35
-
36
-
37
-
38
-
39
-
40
-
41
-
42
-
43
-
44
-
45
-
46
-
47
-
48
-
49
-
50
-
51
-
 52
52 -
 53
53 -
 54
54 -
 55
55 -
 56
56 -
 57
57 -
 58
58 -
 59
59 -
 60
60 -
 61
61 -
 62
62 -
 63
63 -
 64
64 -
 65
65 -
 66
66 -
 67
67 -
 68
68 -
 69
69 -
 70
70 -
 71
71 -
 72
72 -
73
-
74
-
75
-
76
-
77
-
78
-
79
-
80
-
81
-
82
-
83
-
84
-
85
-
86
-
87
-
88
-
89
-
90
-
91
-
92
-
93
-
94
-
95
-
96
-
97
-
98
-
99
-
100
-
101
-
102
-
103
-
104
-
105
-
106
-
107
-
108
-
109
-
110
-
111
-
112
-
113
-
114
-
115
-
116
-
117
-
118
-
119
-
120
-
121
-
122
-
123
-
124
 |
 |

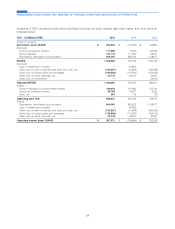
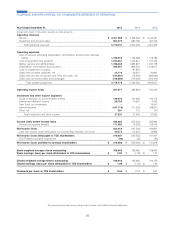
measures of TDS’ operating results before significant recurring non-cash charges, gains and losses, and other items as
indicated below.
TDS – CONSOLIDATED 2015 2014 2013
(Dollars in thousands)
Net income (loss) (GAAP) ............................. $ 262,610 $ (147,292) $ 166,821
Add back:
Income tax expense (benefit) ........................... 171,992 (4,932) 126,043
Interest expense ................................... 141,719 111,397 98,811
Depreciation, amortization and accretion .................... 844,361 836,532 1,018,077
EBITDA ......................................... 1,420,682 795,705 1,409,752
Add back:
Loss on impairment of assets .......................... –87,802 –
(Gain) loss on sale of business and other exit costs, net .......... (135,887) (15,846) (300,656)
(Gain) loss on license sales and exchanges ................. (146,884) (112,993) (255,479)
(Gain) loss on asset disposals, net ....................... 22,176 26,531 30,841
(Gain) loss on investments ............................ –– (14,547)
Adjusted EBITDA .................................. 1,160,087 781,199 869,911
Deduct:
Equity in earnings of unconsolidated entities ................. 140,076 131,965 132,714
Interest and dividend income ........................... 38,783 16,957 9,092
Other, net ....................................... 391 115 (37)
Operating cash flow ................................ 980,837 632,162 728,142
Deduct:
Depreciation, amortization and accretion .................... 844,361 836,532 1,018,077
Loss on impairment of assets .......................... –87,802 –
(Gain) loss on sale of business and other exit costs, net .......... (135,887) (15,846) (300,656)
(Gain) loss on license sales and exchanges ................. (146,884) (112,993) (255,479)
(Gain) loss on asset disposals, net ....................... 22,176 26,531 30,841
Operating income (loss) (GAAP) ........................ $ 397,071 $ (189,864) $ 235,359
54
MANAGEMENT’S DISCUSSION AND ANALYSIS OF FINANCIAL CONDITION AND RESULTS OF OPERATIONS