US Cellular 2015 Annual Report Download - page 36
Download and view the complete annual report
Please find page 36 of the 2015 US Cellular annual report below. You can navigate through the pages in the report by either clicking on the pages listed below, or by using the keyword search tool below to find specific information within the annual report.-
 1
1 -
2
-
3
-
4
-
5
-
6
-
7
-
8
-
9
-
10
-
11
-
12
-
13
-
14
-
15
-
16
-
17
-
18
-
19
-
20
-
21
-
22
-
23
-
24
-
25
-
 26
26 -
 27
27 -
 28
28 -
 29
29 -
 30
30 -
 31
31 -
 32
32 -
 33
33 -
 34
34 -
 35
35 -
 36
36 -
 37
37 -
 38
38 -
 39
39 -
 40
40 -
 41
41 -
 42
42 -
 43
43 -
 44
44 -
 45
45 -
 46
46 -
47
-
48
-
49
-
50
-
51
-
52
-
53
-
54
-
55
-
56
-
57
-
58
-
59
-
60
-
61
-
62
-
63
-
64
-
65
-
66
-
67
-
68
-
69
-
70
-
71
-
72
-
73
-
74
-
75
-
76
-
77
-
78
-
79
-
80
-
81
-
82
-
83
-
84
-
85
-
86
-
87
-
88
-
89
-
90
-
91
-
92
-
93
-
94
-
95
-
96
-
97
-
98
-
99
-
100
-
101
-
102
-
103
-
104
-
105
-
106
-
107
-
108
-
109
-
110
-
111
-
112
-
113
-
114
-
115
-
116
-
117
-
118
-
119
-
120
-
121
-
122
-
123
-
124
 |
 |

11MAR201618514574
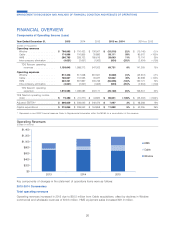
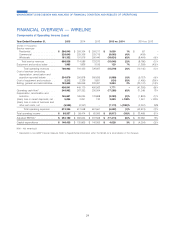
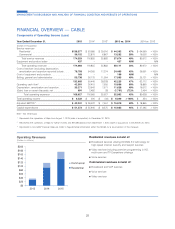
FINANCIAL OVERVIEW — CABLE
Components of Operating Income (Loss)
Year Ended December 31, 2015 20142201312015 vs. 2014 2014 vs. 2013
(Dollars in thousands)
Service revenues
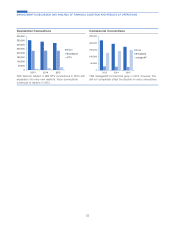
Residential ....................... $138,377 $ 93,985 $ 29,016 $ 44,392 47% $ 64,969 >100%
Commercial ...................... 36,152 22,870 6,867 13,282 58% 16,003 >100%
Total service revenues .............. 174,529 116,855 35,883 57,674 49% 80,972 >100%
Equipment and product sales ............ 437 ––437 N/M – N/M
Total operating revenues ............. 174,966 116,855 35,883 58,111 50% 80,972 >100%
Cost of services (excluding depreciation,
amortization and accretion reported below) . . . 78,758 54,265 17,274 24,493 45% 36,991 >100%
Cost of equipment and products ........... 169 ––169 N/M – N/M
Selling, general and administrative .......... 53,738 36,175 11,054 17,563 49% 25,121 >100%
132,665 90,440 28,328 42,225 47% 62,112 >100%
Operating cash flow* .................. 42,301 26,415 7,555 15,886 60% 18,860 >100%
Depreciation, amortization and accretion ...... 35,271 23,643 7,571 11,628 49% 16,072 >100%
(Gain) loss on asset disposals, net ......... 691 2,482 28 (1,791) (72)% 2,454 >100%
Total operating expenses ........... 168,627 116,565 35,927 52,062 45% 80,638 >100%
Total operating income ................. $ 6,339 $ 290 $ (44) $ 6,049 >100% $ 334 >100%
Adjusted EBITDA* .................... $ 42,341 $ 26,422 $ 7,557 $ 15,919 60% $ 18,865 >100%
Capital expenditures .................. $ 51,573 $ 35,640 $ 8,375 $ 15,933 45% $ 27,265 >100%
N/M – Not meaningful
1Represents the operations of Baja from August 1, 2013 (date of acquisition) to December 31, 2013.
2Represents the operations of Baja for twelve months and BendBroadband from September 1, 2014 (date of acquisition) to December 31, 2014.
* Represents a non-GAAP financial measure. Refer to Supplemental Information within this MD&A for a reconciliation of this measure.
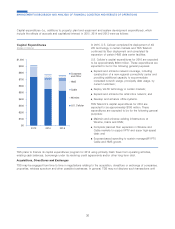
Residential revenues consist of:
ᔢBroadband services utilizing DOCSIS 3.0 technology for
high-speed internet, security and support services
ᔢVideo services including premium programming in HD,
multi-room and TV Everywhere offerings
ᔢVoice services
Commercial revenues consist of:
ᔢBroadband and VoIP services
ᔢVoice services
ᔢVideo services
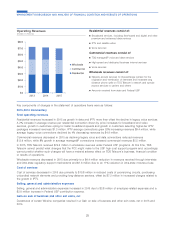
$0
$20
$40
$60
$80
$100
$120
$140
$160
$180
$200
2013 2014 2015
Commercial
Residential
28
MANAGEMENT’S DISCUSSION AND ANALYSIS OF FINANCIAL CONDITION AND RESULTS OF OPERATIONS
Operating Revenues
(Dollars in millions)