US Cellular 2015 Annual Report Download - page 51
Download and view the complete annual report
Please find page 51 of the 2015 US Cellular annual report below. You can navigate through the pages in the report by either clicking on the pages listed below, or by using the keyword search tool below to find specific information within the annual report.-
 1
1 -
2
-
3
-
4
-
5
-
6
-
7
-
8
-
9
-
10
-
11
-
12
-
13
-
14
-
15
-
16
-
17
-
18
-
19
-
20
-
21
-
22
-
23
-
24
-
25
-
26
-
27
-
28
-
29
-
30
-
31
-
32
-
33
-
34
-
35
-
36
-
37
-
38
-
39
-
40
-
 41
41 -
 42
42 -
 43
43 -
 44
44 -
 45
45 -
 46
46 -
 47
47 -
 48
48 -
 49
49 -
 50
50 -
 51
51 -
 52
52 -
 53
53 -
 54
54 -
 55
55 -
 56
56 -
 57
57 -
 58
58 -
 59
59 -
 60
60 -
 61
61 -
62
-
63
-
64
-
65
-
66
-
67
-
68
-
69
-
70
-
71
-
72
-
73
-
74
-
75
-
76
-
77
-
78
-
79
-
80
-
81
-
82
-
83
-
84
-
85
-
86
-
87
-
88
-
89
-
90
-
91
-
92
-
93
-
94
-
95
-
96
-
97
-
98
-
99
-
100
-
101
-
102
-
103
-
104
-
105
-
106
-
107
-
108
-
109
-
110
-
111
-
112
-
113
-
114
-
115
-
116
-
117
-
118
-
119
-
120
-
121
-
122
-
123
-
124
 |
 |

accounting for built licenses, newly defined one unit of accounting for built licenses, and seven unbuilt licenses. As part
of the assessment, U.S. Cellular considered several qualitative factors, including analysts’ estimates of license values,
recent spectrum auction results, recent U.S. Cellular transactions and other industry and market factors. Based on this
assessment, U.S. Cellular concluded that it was more likely than not that the fair value of the licenses in each unit of
accounting exceeded the respective carrying values. Therefore, no impairment of licenses existed and no Step 1
impairment evaluation was completed.
Goodwill – U.S. Cellular
U.S. Cellular has recorded Goodwill as a result of the acquisition of wireless companies. Prior to the fourth quarter of
2015, U.S. Cellular was comprised of four reporting units based on geographic service areas. Due to the evolution of the
business and the extent to which U.S. Cellular has similar customers, products and services, and operations across all
geographic regions, and also operates one interdependent network, U.S. Cellular determined that it had one reporting
unit as of November 1, 2015. The change in reporting units required U.S. Cellular to perform an impairment test for both
the previous four reporting units and one new reporting unit as of November 1, 2015. The newly defined one reporting
unit hereafter is referred to as U.S. Cellular.
Based on the results of the annual Goodwill impairment assessment performed as of November 1, 2015, the fair value
of each of the historical four and U.S. Cellular reporting units exceeded their respective carrying values. Therefore, no
impairment of Goodwill existed.
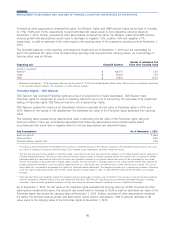
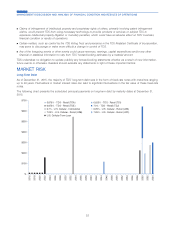
A discounted cash flow approach was used to value each reporting unit, using value drivers and risks specific to the
industry and current economic factors. The cash flow estimates incorporated assumptions that market participants would
use in their estimates of fair value and may not be indicative of U.S. Cellular specific assumptions. However, the
discount rate used in the analysis accounts for any additional risk a market participant might place on integrating U.S.
Cellular into its operations at the level of cash flows assumed under this approach. The most significant assumptions
made in this process were the revenue growth rate (shown as a compound annual growth rate in the table below), the
terminal revenue growth rate and the discount rate. There are uncertainties associated with these key assumptions and
potential events and/or circumstances that could have a negative effect on these key assumptions described below.
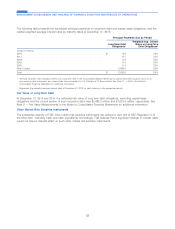
Key Assumptions As of November 1, 2015
Revenue growth rate1..................................................... 2.3%
Terminal revenue growth rate1............................................... 2.0%
Discount rate2......................................................... 9.5%
1There are risks that could negatively impact the projected revenue growth rates, including, but not limited to: the success of new and existing products/
services, competition, operational difficulties and customer churn.
2The discount rate of each reporting unit was computed by calculating the weighted average cost of capital of market participants with businesses
reasonably comparable to U.S. Cellular. The discount rate is dependent upon the cost of capital of other industry market participants and the company
specific risk. To the extent that the weighted average cost of capital of industry participants increases or U.S. Cellular’s risk in relation to its peers
increases, this would decrease the estimated fair value of the reporting units. The weighted average cost of capital may increase if borrowing costs rise,
market participants weight more of their capital structure towards equity vs. debt, or other elements affecting the estimated cost of equity increase.
Provided all other assumptions remained the same, for the historical four reporting units, the discount rate would have to
increase to a range of 9.5% to 11.0% to yield an estimated fair value of reporting units that equal their respective
carrying values at November 1, 2015. Further, assuming all other assumptions remained the same, for the historical four
reporting units, the terminal growth rate assumptions would need to decrease to amounts ranging from negative 1.5% to
positive 2.0% to yield an estimated fair value equal to the carrying values of the respective reporting unit at November 1,
2015.
Provided all other assumptions remained the same, for the U.S. Cellular reporting unit, the discount rate would have to
increase to 10.6% to yield an estimated fair value of the reporting unit that equals its carrying value at November 1,
2015. Further, assuming all other assumptions remained the same, for the U.S. Cellular reporting unit, the terminal
growth rate assumption would need to decrease to negative 0.6% to yield an estimated fair value equal to the carrying
value of the reporting unit at November 1, 2015.
43
MANAGEMENT’S DISCUSSION AND ANALYSIS OF FINANCIAL CONDITION AND RESULTS OF OPERATIONS