US Cellular 2015 Annual Report Download - page 121
Download and view the complete annual report
Please find page 121 of the 2015 US Cellular annual report below. You can navigate through the pages in the report by either clicking on the pages listed below, or by using the keyword search tool below to find specific information within the annual report.-
 1
1 -
2
-
3
-
4
-
5
-
6
-
7
-
8
-
9
-
10
-
11
-
12
-
13
-
14
-
15
-
16
-
17
-
18
-
19
-
20
-
21
-
22
-
23
-
24
-
25
-
26
-
27
-
28
-
29
-
30
-
31
-
32
-
33
-
34
-
35
-
36
-
37
-
38
-
39
-
40
-
41
-
42
-
43
-
44
-
45
-
46
-
47
-
48
-
49
-
50
-
51
-
52
-
53
-
54
-
55
-
56
-
57
-
58
-
59
-
60
-
61
-
62
-
63
-
64
-
65
-
66
-
67
-
68
-
69
-
70
-
71
-
72
-
73
-
74
-
75
-
76
-
77
-
78
-
79
-
80
-
81
-
82
-
83
-
84
-
85
-
86
-
87
-
88
-
89
-
90
-
91
-
92
-
93
-
94
-
95
-
96
-
97
-
98
-
99
-
100
-
101
-
102
-
103
-
104
-
105
-
106
-
107
-
108
-
109
-
110
-
 111
111 -
 112
112 -
 113
113 -
 114
114 -
 115
115 -
 116
116 -
 117
117 -
 118
118 -
 119
119 -
 120
120 -
 121
121 -
 122
122 -
 123
123 -
 124
124
 |
 |

12MAR201601532903
Stock and Dividend Information
TDS’ Common Shares are listed on the New York Stock Exchange (‘‘NYSE’’) under the symbol ‘‘TDS.’’ As of January 31,
2016, the last trading day of the month, TDS Common Shares were held by approximately 1,377 record owners, and the
Series A Common Shares were held by approximately 76 record owners.
TDS has paid cash dividends on its common stock since 1974, and paid dividends of $0.56 per Common and Series A
Common Share during 2015. During 2014, TDS paid dividends of $0.54 per Common and Series A Common Share.
The Common Shares of United States Cellular Corporation, an 84%-owned subsidiary of TDS, are listed on the NYSE
under the symbol ‘‘USM.’’
See ‘‘Consolidated Quarterly Information (Unaudited)’’ for information on the high and low trading prices of the TDS
Common Shares for 2015 and 2014.
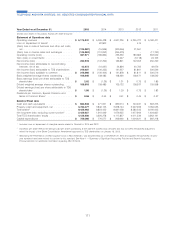
Stock Performance Graph
The following chart provides a comparison of TDS’ cumulative total return to shareholders (stock price appreciation plus
dividends) during the previous five years to the returns of the Standard & Poor’s 500 Composite Stock Price Index and
the Dow Jones U.S. Telecommunications Index. As of December 31, 2015, the Dow Jones U.S. Telecommunications
Index was composed of the following companies: 8X8 Inc., AT&T Inc., CenturyLink Inc., Frontier Communications Corp.,
Level 3 Communications Inc., SBA Communications Corp., Sprint Corp., T-Mobile US Inc., Telephone and Data
Systems, Inc. (TDS) and Verizon Communications Inc.
$0
$50
$100
$150
$200
2010 2011 2012 2013 2014 2015
Telephone & Data Systems Inc. S&P 500 Index Dow Jones U.S. Telecommunications Index
* Cumulative total return assumes reinvestment of dividends
2010 2011 2012 2013 2014 2015
Telephone and Data Systems Common Shares
(NYSE: TDS) $ 100 $ 72.10 $ 68.43 $ 81.39 $ 81.41 $ 85.22
S&P 500 Index 100 102.11 118.45 156.82 178.28 180.75
Dow Jones U.S. Telecommunications Index 100 103.97 123.50 140.95 144.32 149.39
Assumes $100.00 invested at the close of trading on the last trading day preceding the first day of 2010, in TDS
Common Shares, S&P 500 Index and the Dow Jones U.S. Telecommunications Index.
Dividend Reinvestment Plan
TDS’ dividend reinvestment plans provide its common and preferred shareholders with a convenient and economical
way to participate in the future growth of TDS. Holders of record of ten (10) or more Common Shares or Preferred
113
TELEPHONE AND DATA SYSTEMS, INC. SHAREHOLDER INFORMATION