US Cellular 2015 Annual Report Download - page 98
Download and view the complete annual report
Please find page 98 of the 2015 US Cellular annual report below. You can navigate through the pages in the report by either clicking on the pages listed below, or by using the keyword search tool below to find specific information within the annual report.-
 1
1 -
2
-
3
-
4
-
5
-
6
-
7
-
8
-
9
-
10
-
11
-
12
-
13
-
14
-
15
-
16
-
17
-
18
-
19
-
20
-
21
-
22
-
23
-
24
-
25
-
26
-
27
-
28
-
29
-
30
-
31
-
32
-
33
-
34
-
35
-
36
-
37
-
38
-
39
-
40
-
41
-
42
-
43
-
44
-
45
-
46
-
47
-
48
-
49
-
50
-
51
-
52
-
53
-
54
-
55
-
56
-
57
-
58
-
59
-
60
-
61
-
62
-
63
-
64
-
65
-
66
-
67
-
68
-
69
-
70
-
71
-
72
-
73
-
74
-
75
-
76
-
77
-
78
-
79
-
80
-
81
-
82
-
83
-
84
-
85
-
86
-
87
-
 88
88 -
 89
89 -
 90
90 -
 91
91 -
 92
92 -
 93
93 -
 94
94 -
 95
95 -
 96
96 -
 97
97 -
 98
98 -
 99
99 -
 100
100 -
 101
101 -
 102
102 -
 103
103 -
 104
104 -
 105
105 -
 106
106 -
 107
107 -
 108
108 -
109
-
110
-
111
-
112
-
113
-
114
-
115
-
116
-
117
-
118
-
119
-
120
-
121
-
122
-
123
-
124
 |
 |

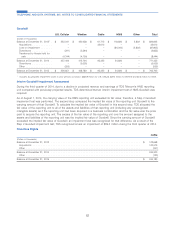
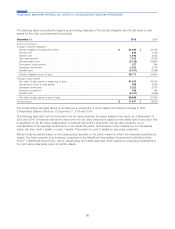
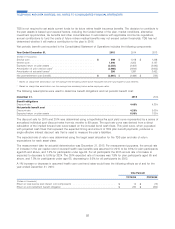
The following table reconciles the beginning and ending balances of the benefit obligation and the fair value of plan
assets for the other post-retirement benefit plan.
December 31, 2015 2014
(Dollars in thousands)
Change in benefit obligation
Benefit obligation at beginning of year .................................. $ 34,645 $ 46,142
Service cost .................................................. 549 1,018
Interest cost .................................................. 1,540 2,255
Plan amendments .............................................. 7,412 (2,057)
Actuarial (gain) loss ............................................. (3,723) (10,897)
Prescription drug subsidy .......................................... 227 264
Employee contribution ............................................ 2,222 2,216
Benefits paid ................................................. (4,101) (4,296)
Benefit obligation at end of year ...................................... 38,771 34,645
Change in plan assets
Fair value of plan assets at beginning of year ............................. 51,324 49,743
Actual return (loss) on plan assets .................................... 395 3,495
Employee contribution ............................................ 2,222 2,216
Employer contribution ............................................ 168 166
Benefits paid ................................................. (4,101) (4,296)
Fair value of plan assets at end of year ................................. 50,008 51,324
Funded status .................................................. $ 11,237 $ 16,679
The funded status identified above is recorded as a component of Other assets and deferred charges in TDS’
Consolidated Balance Sheet as of December 31, 2015 and 2014.
The following table sets forth by level within the fair value hierarchy the plans’ assets at fair value, as of December 31,
2015 and 2014. A financial instrument’s level within the fair value hierarchy is based on the lowest level of any input that
is significant to the fair value measurement. A financial instrument’s level within the fair value hierarchy is not
representative of its expected performance or its overall risk profile, and therefore Level 3 assets are not necessarily
higher risk than Level 2 assets or Level 1 assets. There were no Level 3 assets for any years presented.
Mutual funds are valued based on the closing price reported on the active market on which the individual securities are
traded. The bank common trust is entirely comprised of the BlackRock Intermediate Government/Credit Bond Index
Fund F (‘‘BlackRock Bond Fund’’) and is valued using the market approach which values the underlying investments in
the fund using observable inputs for similar assets.
90
TELEPHONE AND DATA SYSTEMS, INC. NOTES TO CONSOLIDATED FINANCIAL STATEMENTS