US Cellular 2015 Annual Report Download - page 39
Download and view the complete annual report
Please find page 39 of the 2015 US Cellular annual report below. You can navigate through the pages in the report by either clicking on the pages listed below, or by using the keyword search tool below to find specific information within the annual report.-
 1
1 -
2
-
3
-
4
-
5
-
6
-
7
-
8
-
9
-
10
-
11
-
12
-
13
-
14
-
15
-
16
-
17
-
18
-
19
-
20
-
21
-
22
-
23
-
24
-
25
-
26
-
27
-
28
-
 29
29 -
 30
30 -
 31
31 -
 32
32 -
 33
33 -
 34
34 -
 35
35 -
 36
36 -
 37
37 -
 38
38 -
 39
39 -
 40
40 -
 41
41 -
 42
42 -
 43
43 -
 44
44 -
 45
45 -
 46
46 -
 47
47 -
 48
48 -
 49
49 -
50
-
51
-
52
-
53
-
54
-
55
-
56
-
57
-
58
-
59
-
60
-
61
-
62
-
63
-
64
-
65
-
66
-
67
-
68
-
69
-
70
-
71
-
72
-
73
-
74
-
75
-
76
-
77
-
78
-
79
-
80
-
81
-
82
-
83
-
84
-
85
-
86
-
87
-
88
-
89
-
90
-
91
-
92
-
93
-
94
-
95
-
96
-
97
-
98
-
99
-
100
-
101
-
102
-
103
-
104
-
105
-
106
-
107
-
108
-
109
-
110
-
111
-
112
-
113
-
114
-
115
-
116
-
117
-
118
-
119
-
120
-
121
-
122
-
123
-
124
 |
 |

12MAR201601532511
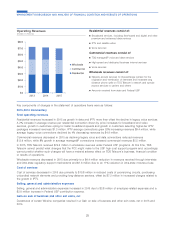
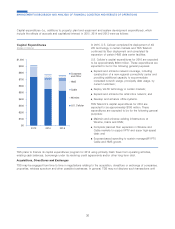
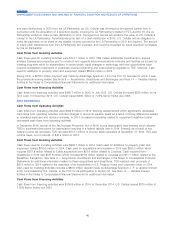
Service revenues consist of:
ᔢCloud and hosting solutions
ᔢManaged services
ᔢEnterprise Resource Planning (‘‘ERP’’) application
management
ᔢProfessional services
ᔢCo-location services
ᔢIT hardware maintenance services
Equipment revenues consist of:
ᔢIT hardware sales
$0
$50
$100
$150
$200
$250
$300
$350
2013 2014 2015
Equipment
Service
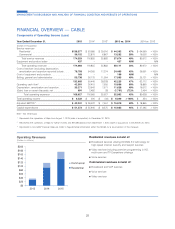
Key components of changes in the statement of operations items were as follows:
2015-2014 Commentary
Growth in recurring services and increases in professional services and maintenance resulted in an increase in Service
revenues in 2015. Equipment and product sales revenues from sales of IT infrastructure hardware solutions increased in
2015 due primarily to higher spending by existing customers. There was a corresponding increase in Cost of equipment
and products and Cost of services needed to support revenue growth. Selling, general and administrative expenses
decreased due to efficiency improvements.
2014-2013 Commentary
Increases in operating revenues and operating expenses in 2014 are due primarily to acquisitions. Acquisitions
contributed $85.1 million to operating revenues. Increases in Equipment and product sales revenues were partially offset
by $15.4 million in lower spending by existing customers. Acquisitions contributed $85.1 million to operating expenses.
Increases in Cost of equipment and products were partially offset by $12.2 million reduced spending on equipment by
existing customers.
As a result of interim testing performed during the third quarter of 2014, TDS determined the carrying value of the HMS
goodwill exceeded the implied fair value of HMS goodwill. As a result, an $84.0 million impairment loss was recognized.
31
MANAGEMENT’S DISCUSSION AND ANALYSIS OF FINANCIAL CONDITION AND RESULTS OF OPERATIONS
Operating Revenues
(Dollars in millions)