US Cellular 2015 Annual Report Download - page 33
Download and view the complete annual report
Please find page 33 of the 2015 US Cellular annual report below. You can navigate through the pages in the report by either clicking on the pages listed below, or by using the keyword search tool below to find specific information within the annual report.-
 1
1 -
2
-
3
-
4
-
5
-
6
-
7
-
8
-
9
-
10
-
11
-
12
-
13
-
14
-
15
-
16
-
17
-
18
-
19
-
20
-
21
-
22
-
 23
23 -
 24
24 -
 25
25 -
 26
26 -
 27
27 -
 28
28 -
 29
29 -
 30
30 -
 31
31 -
 32
32 -
 33
33 -
 34
34 -
 35
35 -
 36
36 -
 37
37 -
 38
38 -
 39
39 -
 40
40 -
 41
41 -
 42
42 -
 43
43 -
44
-
45
-
46
-
47
-
48
-
49
-
50
-
51
-
52
-
53
-
54
-
55
-
56
-
57
-
58
-
59
-
60
-
61
-
62
-
63
-
64
-
65
-
66
-
67
-
68
-
69
-
70
-
71
-
72
-
73
-
74
-
75
-
76
-
77
-
78
-
79
-
80
-
81
-
82
-
83
-
84
-
85
-
86
-
87
-
88
-
89
-
90
-
91
-
92
-
93
-
94
-
95
-
96
-
97
-
98
-
99
-
100
-
101
-
102
-
103
-
104
-
105
-
106
-
107
-
108
-
109
-
110
-
111
-
112
-
113
-
114
-
115
-
116
-
117
-
118
-
119
-
120
-
121
-
122
-
123
-
124
 |
 |

13MAR201603060553
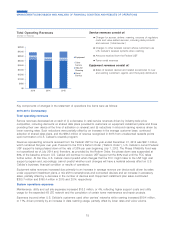
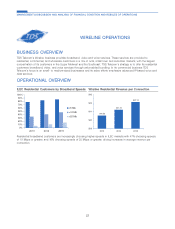
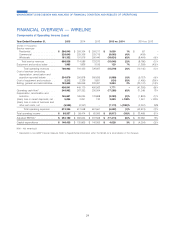
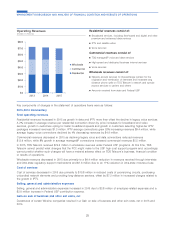
Residential revenues consist of:
ᔢBroadband services, including fiber-based and digital and other
premium and enhanced data services
ᔢIPTV and satellite video
ᔢVoice services
Commercial revenues consist of:
ᔢTDS managedIP voice and data services
ᔢHigh-speed and dedicated business internet services
ᔢVoice services
Wholesale revenues consist of:
ᔢNetwork access services to interexchange carriers for the
origination and termination of interstate and intrastate long
distance phone calls on TDS Telecom’s network and special
access services to carriers and others
ᔢAmounts received from state and Federal USF
$0
$100
$200
$300
$400
$500
$600
$700
$800
2013 2014 2015
Wholesale
Commercial
Residential
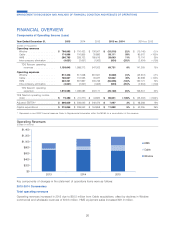
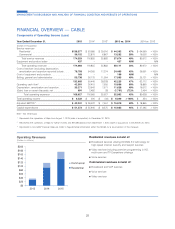
Key components of changes in the statement of operations items were as follows:
2015-2014 Commentary
Total operating revenues
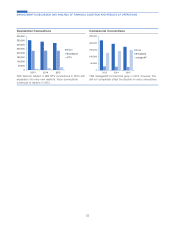
Residential revenues increased in 2015 as growth in data and IPTV more than offset the decline in legacy voice services.
A 2% increase in average revenue per residential connection driven by price increases for broadband and video
services, growth in customers opting for faster broadband speeds and growth in customers selecting higher-tier IPTV
packages increased revenues $1.3 million. IPTV average connections grew 53% increasing revenues $9.4 million, while
average legacy voice connections declined by 4% decreasing revenues by $4.9 million.
Commercial revenues decreased in 2015 as declining legacy voice and data connections reduced revenues
$13.9 million, while 8% growth in average managedIP connections increased commercial revenues $5.5 million.
In 2015, TDS Telecom received $74.6 million in wholesale revenues under Federal USF programs. At this time, TDS
Telecom cannot predict what changes that the FCC might make to the USF high cost support program and, accordingly,
cannot predict whether such changes will have a material adverse effect on TDS Telecom’s business, financial condition
or results of operations.
Wholesale revenues decreased in 2015 due primarily to a $4.4 million reduction in revenues received through inter-state
and intra-state regulatory support mechanisms and $1.6 million due to an 11% reduction in intra-state minutes-of-use.
Cost of services
Cost of services decreased in 2015 due primarily to $10.8 million in reduced costs of provisioning circuits, purchasing
unbundled network elements and providing long-distance services, offset by $7.2 million in increased charges related to
the growth in IPTV.
Selling, general and administrative expenses
Selling, general and administrative expenses increased in 2015 due to $3.8 million of employee-related expenses and a
$2.0 million increase in Federal USF contribution expense.
Gain on sale of business and other exit costs, net
Divestitures of certain Wireline companies resulted in a Gain on sale of business and other exit costs, net in 2015 and
2014.
25
MANAGEMENT’S DISCUSSION AND ANALYSIS OF FINANCIAL CONDITION AND RESULTS OF OPERATIONS
Operating Revenues
(Dollars in millions)