US Cellular 2015 Annual Report Download - page 25
Download and view the complete annual report
Please find page 25 of the 2015 US Cellular annual report below. You can navigate through the pages in the report by either clicking on the pages listed below, or by using the keyword search tool below to find specific information within the annual report.
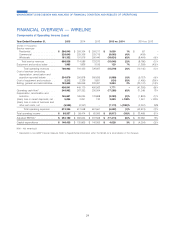
Expenses incurred when U.S. Cellular’s customers used other carriers’ networks while roaming increased $5.8 million, or
3%, driven primarily by an increase in data roaming usage, partially offset by lower rates, lower voice usage, and the
impacts of the Divestiture Transaction and NY1 & NY2 Deconsolidation.
Customer usage expenses decreased $25.9 million, or 11%, driven by impacts of the Divestiture Transaction and NY1 &
NY2 Deconsolidation, by lower fees for platform and content providers, a decrease in long distance charges driven by
rate reductions, and a decrease in circuit costs from LTE migration.
Cost of equipment sold
The increase in Cost of equipment sold was the result of a 22% increase in the average cost per device sold, which
more than offset the impact of selling fewer devices. Average cost per device sold increased due to general customer
preference for higher priced 4G LTE smartphones and tablets. Cost of equipment sold in 2014 includes $280.3 million
related to equipment installment plan sales compared to $0.8 million in 2013. Loss on equipment was $697.9 million and
$674.9 million for 2014 and 2013, respectively.
Selling, general and administrative expenses
Selling, general and administrative expenses decreased $85.5 million, or 5%, in 2014 due to the impacts of the
Divestiture Transaction, NY1 & NY2 Deconsolidation and lower consulting expenses in 2014 related to the billing system
conversion in the prior year.
Depreciation, amortization and accretion expense
Depreciation, amortization and accretion decreased due to acceleration of Depreciation, amortization and accretion
resulting from the Divestiture Transaction. Accelerated depreciation resulting from the Divestiture Transaction was
$13.1 million and $158.5 million in 2014 and 2013, respectively.
(Gain) loss on asset disposals, net
The decrease in Loss on asset disposals was due primarily to fewer write-offs and disposals of certain network assets.
(Gain) loss on sale of business and other exit costs, net
The net gain in 2014 and 2013 was due primarily to $29.3 million and $248.4 million of gain recognized related to the
Divestiture Transaction. See Note 6 — Acquisitions, Divestitures and Exchanges in the Notes to Consolidated Financial
Statements for additional information.
(Gain) loss on license sales and exchanges
The net gain in 2014 and 2013 was due to license sales and exchanges with third parties. See Note 6 — Acquisitions,
Divestitures and Exchanges in the Notes to Consolidated Financial Statements for additional information.
17
MANAGEMENT’S DISCUSSION AND ANALYSIS OF FINANCIAL CONDITION AND RESULTS OF OPERATIONS


