US Cellular 2015 Annual Report Download - page 11
Download and view the complete annual report
Please find page 11 of the 2015 US Cellular annual report below. You can navigate through the pages in the report by either clicking on the pages listed below, or by using the keyword search tool below to find specific information within the annual report.-
 1
1 -
 2
2 -
 3
3 -
 4
4 -
 5
5 -
 6
6 -
 7
7 -
 8
8 -
 9
9 -
 10
10 -
 11
11 -
 12
12 -
 13
13 -
 14
14 -
 15
15 -
 16
16 -
 17
17 -
 18
18 -
 19
19 -
 20
20 -
 21
21 -
 22
22 -
23
-
24
-
25
-
26
-
27
-
28
-
29
-
30
-
31
-
32
-
33
-
34
-
35
-
36
-
37
-
38
-
39
-
40
-
41
-
42
-
43
-
44
-
45
-
46
-
47
-
48
-
49
-
50
-
51
-
52
-
53
-
54
-
55
-
56
-
57
-
58
-
59
-
60
-
61
-
62
-
63
-
64
-
65
-
66
-
67
-
68
-
69
-
70
-
71
-
72
-
73
-
74
-
75
-
76
-
77
-
78
-
79
-
80
-
81
-
82
-
83
-
84
-
85
-
86
-
87
-
88
-
89
-
90
-
91
-
92
-
93
-
94
-
95
-
96
-
97
-
98
-
99
-
100
-
101
-
102
-
103
-
104
-
105
-
106
-
107
-
108
-
109
-
110
-
111
-
112
-
113
-
114
-
115
-
116
-
117
-
118
-
119
-
120
-
121
-
122
-
123
-
124
 |
 |

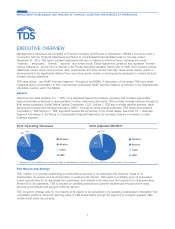
Significant Financial and Operating Matters
The following is a summary of certain selected information contained in the comprehensive MD&A that follows. The
overview does not contain all of the information that may be important. You should carefully read the entire MD&A and
not rely solely on the highlights.
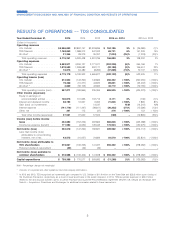
ᔢNet income attributable to TDS shareholders was $219.0 million in 2015, compared to a net loss of $136.4 million in
2014. The year-over-year improvement was attributable to several factors including (i) increased equipment revenues
bolstered by equipment installment plan activity; (ii) reduced cost of equipment sold due to fewer wireless equipment
sales transactions overall and lower cost per wireless unit sold; (iii) reduced selling, general and administrative
expenses; (iv) increased gains from sales and exchanges of businesses and licenses; and (v) non-cash losses on
impairment in 2014. Diluted earnings per share was $1.98 compared to a diluted loss per share of $1.26 one year
ago.
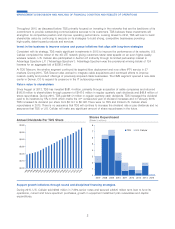
ᔢIn March 2015, U.S. Cellular announced that it would discontinue its loyalty reward program effective September 1,
2015. All unredeemed reward points expired at that time and the deferred revenue balance related to such expired
points was recognized as service revenues. The amount of deferred revenue recognized upon discontinuation of this
program was $58.2 million.
ᔢU.S. Cellular completed license exchanges and the sale of towers outside of its operating markets. See Note 6 —
Acquisitions, Divestitures and Exchanges in the Notes to Consolidated Financial Statements for additional information
related to these transactions.
ᔢTotal additions to Property, plant and equipment were $759.4 million, including expenditures to complete the network
rollout of 4G LTE, construct cell sites, increase capacity in existing cell sites and switches, outfit new and remodel
existing retail stores, enhance billing and other customer management related systems and platforms, perform network
upgrades and fiber expansion, and expand HMS data center facilities.
Terms Used by TDS
All defined terms in this MD&A are used as defined in the Notes to Consolidated Financial Statements, and additional
terms are defined below:
ᔢ4G LTE – fourth generation Long-Term Evolution which is a wireless broadband technology.
ᔢAuction 97 – An FCC auction of AWS-3 spectrum licenses that ended in January 2015.
ᔢAverage Billings per Account (‘‘ABPA’’) – metric is calculated by dividing total postpaid service revenues plus
equipment installment plan billings by the average number of postpaid accounts by the number of months in the
period.
ᔢAverage Billings per User (‘‘ABPU’’) – metric is calculated by dividing total postpaid service revenues plus
equipment installment plan billings by the average number of postpaid customers by the number of months in the
period.
ᔢAverage Revenue per Account (‘‘ARPA’’) – metric is calculated by dividing total postpaid service revenues by the
average number of postpaid accounts by the number of months in the period.
ᔢAverage Revenue per User (‘‘ARPU’’) – metric is calculated by dividing a revenue base by an average number of
customers by the number of months in the period. These revenue bases and customer populations are shown below:
ᔢPostpaid ARPU – consists of total postpaid service revenues and postpaid customers.
ᔢService Revenue ARPU – consists of total postpaid, prepaid and reseller service revenues, inbound roaming and
other service revenues and postpaid, prepaid and reseller customers.
ᔢBroadband Connections – refers to the number of Wireline customers provided high-capacity data circuits via
various technologies, including DSL and dedicated internet circuit technologies or the Cable billable number of lines
into a building for high-speed data services.
ᔢChurn Rate – represents the percentage of the customers that disconnect service each month. These rates represent
the average monthly churn rate for each respective period.
3
MANAGEMENT’S DISCUSSION AND ANALYSIS OF FINANCIAL CONDITION AND RESULTS OF OPERATIONS