US Cellular 2015 Annual Report Download - page 24
Download and view the complete annual report
Please find page 24 of the 2015 US Cellular annual report below. You can navigate through the pages in the report by either clicking on the pages listed below, or by using the keyword search tool below to find specific information within the annual report.-
 1
1 -
2
-
3
-
4
-
5
-
6
-
7
-
8
-
9
-
10
-
11
-
12
-
13
-
 14
14 -
 15
15 -
 16
16 -
 17
17 -
 18
18 -
 19
19 -
 20
20 -
 21
21 -
 22
22 -
 23
23 -
 24
24 -
 25
25 -
 26
26 -
 27
27 -
 28
28 -
 29
29 -
 30
30 -
 31
31 -
 32
32 -
 33
33 -
 34
34 -
35
-
36
-
37
-
38
-
39
-
40
-
41
-
42
-
43
-
44
-
45
-
46
-
47
-
48
-
49
-
50
-
51
-
52
-
53
-
54
-
55
-
56
-
57
-
58
-
59
-
60
-
61
-
62
-
63
-
64
-
65
-
66
-
67
-
68
-
69
-
70
-
71
-
72
-
73
-
74
-
75
-
76
-
77
-
78
-
79
-
80
-
81
-
82
-
83
-
84
-
85
-
86
-
87
-
88
-
89
-
90
-
91
-
92
-
93
-
94
-
95
-
96
-
97
-
98
-
99
-
100
-
101
-
102
-
103
-
104
-
105
-
106
-
107
-
108
-
109
-
110
-
111
-
112
-
113
-
114
-
115
-
116
-
117
-
118
-
119
-
120
-
121
-
122
-
123
-
124
 |
 |

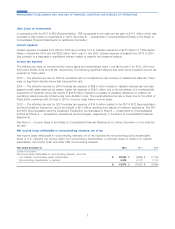
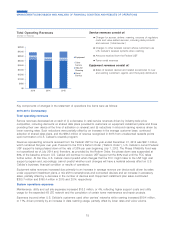
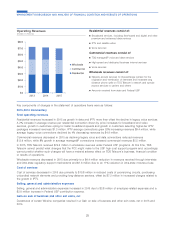
Customer usage expenses decreased $27.6 million, or 13%, driven by lower fees for platform and content providers, a
decrease in long distance charges driven by rate reductions, and a decrease in circuit costs from the migration to LTE.
U.S. Cellular expects system operations expenses to increase in the future to support the continued growth in cell sites
and other network facilities as it continues to add capacity, enhance quality and deploy new technologies as well as to
support increases in total customer usage, particularly data usage. However, these increases are expected to be offset
to some extent by cost savings generated by shifting data traffic to the 4G LTE network from the 3G network.
Cost of equipment sold
The decrease in Cost of equipment sold is a result of an 11% reduction in devices sold and a decrease in the average
cost per device sold driven by the lower cost of smartphones and connected devices. Cost of equipment sold in 2015
included $448.7 million related to equipment installment plan sales compared to $280.3 million in 2014. Loss on
equipment was $406.4 million and $697.9 million for 2015 and 2014, respectively.
Selling, general and administrative expenses
Selling expenses decreased $20.5 million, or 3%, due primarily to lower agent and retail commission expenses driven by
fewer activations and renewals, partially offset by increased advertising expenses.
General and administrative expenses decreased $77.7 million, or 9%, due primarily to lower consulting expenses related
to the billing system and customer service operations, and lower rates for roamer administration.
Depreciation, amortization and accretion expense
Depreciation, amortization and accretion expense remained relatively flat year over year.
(Gain) loss on asset disposals, net
The decrease in Loss on asset disposals was due primarily to fewer write-offs and disposals of certain network assets.
(Gain) loss on sale of business and other exit costs, net
The net gain in 2015 was due primarily to a $108.2 million gain recognized on the Tower Sale. The net gain in 2014 was
due primarily to $29.3 million of gain related to the continuing impact of the Divestiture Transaction. See Note 6 —
Acquisitions, Divestitures and Exchanges in the Notes to Consolidated Financial Statements for additional information.
(Gain) loss on license sales and exchanges, net
The net gains in 2015 and 2014 were due to license sales and exchanges with third parties. See Note 6 — Acquisitions,
Divestitures and Exchanges in the Notes to Consolidated Financial Statements for additional information.
2014-2013 Commentary
Total operating revenues
Service revenues decreased as a result of a decrease in the average customer base (including the reductions caused
by the Divestiture Transaction and NY1 and NY2 Deconsolidation) and a reduction in revenues from the Federal USF. A
decrease in Inbound roaming revenues caused by reductions in inbound roaming rates and voice volumes partially
offset by higher inbound roaming data usage further contributed to the decrease in service revenues.
Such reductions were partially offset by increased revenues as a result of higher smartphone penetration and tower
rental revenues.
Equipment sales revenues increased due to an increase in the average revenue per device sold due primarily to the
implementation of equipment installment plans on a broad basis in 2014, and increases in the sales of connected
devices and accessories. This increase is partially offset by a decrease in sales of other device categories, primarily the
feature phone category, and the effects of the Divestiture Transaction and the NY1 & NY2 Deconsolidation. Equipment
installment plan sales contributed $190.4 million and $0.8 million in 2014 and 2013, respectively.
System operations expenses
Maintenance, utility and cell site expenses increased $26.6 million, or 8%, reflecting higher support costs for the
expanded 4G LTE network and completion of certain maintenance projects, partially offset by the impacts of the
Divestiture Transaction and NY1 & NY2 Deconsolidation.
16
MANAGEMENT’S DISCUSSION AND ANALYSIS OF FINANCIAL CONDITION AND RESULTS OF OPERATIONS