US Cellular 2015 Annual Report Download - page 68
Download and view the complete annual report
Please find page 68 of the 2015 US Cellular annual report below. You can navigate through the pages in the report by either clicking on the pages listed below, or by using the keyword search tool below to find specific information within the annual report.-
 1
1 -
2
-
3
-
4
-
5
-
6
-
7
-
8
-
9
-
10
-
11
-
12
-
13
-
14
-
15
-
16
-
17
-
18
-
19
-
20
-
21
-
22
-
23
-
24
-
25
-
26
-
27
-
28
-
29
-
30
-
31
-
32
-
33
-
34
-
35
-
36
-
37
-
38
-
39
-
40
-
41
-
42
-
43
-
44
-
45
-
46
-
47
-
48
-
49
-
50
-
51
-
52
-
53
-
54
-
55
-
56
-
57
-
 58
58 -
 59
59 -
 60
60 -
 61
61 -
 62
62 -
 63
63 -
 64
64 -
 65
65 -
 66
66 -
 67
67 -
 68
68 -
 69
69 -
 70
70 -
 71
71 -
 72
72 -
 73
73 -
 74
74 -
 75
75 -
 76
76 -
 77
77 -
 78
78 -
79
-
80
-
81
-
82
-
83
-
84
-
85
-
86
-
87
-
88
-
89
-
90
-
91
-
92
-
93
-
94
-
95
-
96
-
97
-
98
-
99
-
100
-
101
-
102
-
103
-
104
-
105
-
106
-
107
-
108
-
109
-
110
-
111
-
112
-
113
-
114
-
115
-
116
-
117
-
118
-
119
-
120
-
121
-
122
-
123
-
124
 |
 |

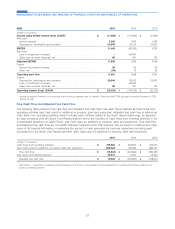
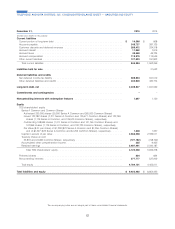
Year Ended December 31, 2015 2014 2013
(Dollars in thousands)
Cash flows from operating activities
Net income (loss) ............................................ $ 262,610 $ (147,292) $ 166,821
Add (deduct) adjustments to reconcile net income (loss) to net cash flows from operating
activities
Depreciation, amortization and accretion ............................ 844,361 836,532 1,018,077
Bad debts expense ........................................ 112,292 107,861 105,629
Stock-based compensation expense .............................. 40,400 35,793 30,338
Deferred income taxes, net .................................... 70,849 71,713 (67,150)
Equity in earnings of unconsolidated entities .......................... (140,076) (131,965) (132,714)
Distributions from unconsolidated entities ............................ 60,060 112,349 127,929
Loss on impairment of assets .................................. –87,802 –
(Gain) loss on asset disposals, net ............................... 22,176 26,531 30,841
(Gain) loss on sale of business and other exit costs, net ................... (135,887) (15,846) (300,656)
(Gain) loss on license sales and exchanges .......................... (146,884) (112,993) (255,479)
(Gain) loss on investments .................................... –– (14,547)
Noncash interest expense .................................... 2,760 1,642 2,463
Other operating activities ..................................... (769) (641) 612
Changes in assets and liabilities from operations
Accounts receivable ........................................ (120,230) 17,629 (293,729)
Equipment installment plans receivable ............................. (133,734) (188,829) (591)
Inventory .............................................. 115,482 (29,149) (83,536)
Accounts payable ......................................... 7,245 (117,264) 86,028
Customer deposits and deferred revenues ........................... (35,850) 33,952 66,460
Accrued taxes ........................................... 38,259 (122,921) 17,388
Accrued interest .......................................... 4,046 1,277 380
Other assets and liabilities .................................... (77,416) (71,369) (9,954)
Net cash provided by operating activities ........................... 789,694 394,812 494,610
Cash flows from investing activities
Cash used for additions to property, plant and equipment ..................... (800,628) (799,496) (883,797)
Cash paid for acquisitions and licenses ............................... (286,861) (295,253) (314,570)
Cash received from divestitures and exchanges ........................... 342,870 187,645 811,120
Cash received for investments ..................................... –50,000 115,000
Federal Communications Commission deposit ........................... –(60,000) –
Other investing activities ........................................ 6,932 7,360 11,594
Net cash used in investing activities ............................. (737,687) (909,744) (260,653)
Cash flows from financing activities
Repayment of long-term debt ..................................... (816) (1,072) (1,581)
Issuance of long-term debt ...................................... 525,000 275,000 37
Repayment of borrowing under revolving credit facility ....................... –(150,000) –
Borrowing under revolving credit facility ............................... –150,000 –
TDS Common Shares reissued for benefit plans, net of tax payments .............. 13,329 (2,019) 9,654
U.S. Cellular Common Shares reissued for benefit plans, net of tax payments .......... 2,167 830 5,784
Repurchase of TDS Common Shares ................................. –(39,096) (9,692)
Repurchase of U.S. Cellular Common Shares ............................ (6,188) (18,943) (18,544)
Dividends paid to TDS shareholders ................................. (61,219) (58,040) (55,293)
U.S. Cellular dividends paid to noncontrolling public shareholders ................ –– (75,235)
Payment of debt issuance costs ................................... (13,026) (10,215) (23)
Distributions to noncontrolling interests ................................ (6,369) (627) (3,766)
Payments to acquire additional interest in subsidiaries ....................... (3,983) – (4,505)
Other financing activities ........................................ 11,840 11,001 8,740
Net cash provided by (used in) financing activities ..................... 460,735 156,819 (144,424)
Net increase (decrease) in cash and cash equivalents ..................... 512,742 (358,113) 89,533
Cash and cash equivalents
Beginning of period ........................................... 471,901 830,014 740,481
End of period .............................................. $ 984,643 $ 471,901 $ 830,014
The accompanying notes are an integral part of these consolidated financial statements.
60
TELEPHONE AND DATA SYSTEMS, INC. CONSOLIDATED STATEMENT OF CASH FLOWS