US Cellular 2015 Annual Report Download - page 112
Download and view the complete annual report
Please find page 112 of the 2015 US Cellular annual report below. You can navigate through the pages in the report by either clicking on the pages listed below, or by using the keyword search tool below to find specific information within the annual report.-
 1
1 -
2
-
3
-
4
-
5
-
6
-
7
-
8
-
9
-
10
-
11
-
12
-
13
-
14
-
15
-
16
-
17
-
18
-
19
-
20
-
21
-
22
-
23
-
24
-
25
-
26
-
27
-
28
-
29
-
30
-
31
-
32
-
33
-
34
-
35
-
36
-
37
-
38
-
39
-
40
-
41
-
42
-
43
-
44
-
45
-
46
-
47
-
48
-
49
-
50
-
51
-
52
-
53
-
54
-
55
-
56
-
57
-
58
-
59
-
60
-
61
-
62
-
63
-
64
-
65
-
66
-
67
-
68
-
69
-
70
-
71
-
72
-
73
-
74
-
75
-
76
-
77
-
78
-
79
-
80
-
81
-
82
-
83
-
84
-
85
-
86
-
87
-
88
-
89
-
90
-
91
-
92
-
93
-
94
-
95
-
96
-
97
-
98
-
99
-
100
-
101
-
 102
102 -
 103
103 -
 104
104 -
 105
105 -
 106
106 -
 107
107 -
 108
108 -
 109
109 -
 110
110 -
 111
111 -
 112
112 -
 113
113 -
 114
114 -
 115
115 -
 116
116 -
 117
117 -
 118
118 -
 119
119 -
 120
120 -
 121
121 -
 122
122 -
123
-
124
 |
 |

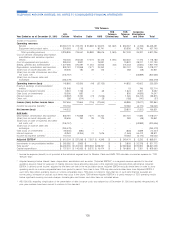
TDS Telecom
TDS TDS Corporate,
U.S. Telecom Telecom Eliminations
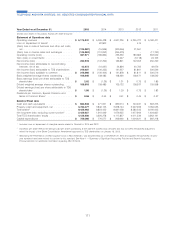
Year Ended or as of December 31, 2014 Cellular Wireline Cable HMS Eliminations Total and Other Total
(Dollars in thousands)
Operating revenues
Service ....................$3,397,937 $ 714,586 $116,855 $ 109,766 $(3,697) $ 937,510 $ (6,793) $4,328,654
Equipment and product sales ...... 494,810 1,836 – 148,966 – 150,802 35,172 680,784
Total operating revenues ........ 3,892,747 716,422 116,855 258,732 (3,697) 1,088,312 28,379 5,009,438
Cost of services (excluding Depreciation,
amortization and accretion expense
reported below) ............... 769,911 256,878 54,265 77,392 (3,504) 385,031 9,716 1,164,658
Cost of equipment and products ...... 1,192,669 2,336 – 126,362 – 128,698 25,444 1,346,811
Selling, general and administrative ..... 1,591,914 189,956 36,175 53,020 (193) 278,958 (5,065) 1,865,807
Depreciation, amortization and accretion . 605,997 169,044 23,643 26,912 – 219,599 10,936 836,532
Loss on impairment of assets ........ – – – 84,000 – 84,000 3,802 87,802
(Gain) loss on asset disposals, net .... 21,469 2,091 2,482 181 – 4,754 308 26,531
(Gain) loss on sale of business and other
exit costs, net ................ (32,830) (2,357) – – – (2,357) 19,341 (15,846)
(Gain) loss on license sales and
exchanges .................. (112,993) – – – – – – (112,993)
Operating income (loss) .......... (143,390) 98,474 290 (109,135) – (10,371) (36,103) (189,864)
Equity in earnings of unconsolidated
entities .................... 129,764 8 – – – 8 2,193 131,965
Interest and dividend income ........ 12,148 2,396 8 26 – 2,430 2,379 16,957
Interest expense ................ (57,386) 2,695 95 (1,602) – 1,188 (55,199) (111,397)
Other, net .................... 160 (32) (1) 12 – (21) (24) 115
Income (loss) before income taxes . . . (58,704) 103,541 392 (110,699) – (6,766) (86,754) (152,224)
Income tax expense (benefit)1........ (11,782) 17,590 (10,740) (4,932)
Net income (loss) .............. (46,922) (24,356) (76,014) (147,292)
Add back:
Depreciation, amortization and accretion . 605,997 169,044 23,643 26,912 – 219,599 10,936 836,532
Loss on impairment of assets ........ – – – 84,000 – 84,000 3,802 87,802
(Gain) loss on asset disposals, net .... 21,469 2,091 2,482 181 – 4,754 308 26,531
(Gain) loss on sale of business and other
exit costs, net ................ (32,830) (2,357) – – – (2,357) 19,341 (15,846)
(Gain) loss on license sales and
exchanges .................. (112,993) – – – – – – (112,993)
Interest expense ................ 57,386 (2,695) (95) 1,602 – (1,188) 55,199 111,397
Income tax expense (benefit)1........ (11,782) 17,590 (10,740) (4,932)
Adjusted EBITDA2..............$ 480,325 $ 269,624 $ 26,422 $ 1,996 $ – $ 298,042 $ 2,832 $ 781,199
Investments in unconsolidated entities . . . $ 283,014 $ 3,803 $ – $ – $ – $ 3,803 $ 34,912 $ 321,729
Total assets3..................$6,462,309 $1,419,478 $563,585 $ 268,972 $ – $2,252,035 $140,078 $8,854,422
Capital expenditures .............$ 557,615 $ 135,805 $ 35,640 $ 36,618 $ – $ 208,063 $ 4,899 $ 770,577
104
TELEPHONE AND DATA SYSTEMS, INC. NOTES TO CONSOLIDATED FINANCIAL STATEMENTS