US Cellular 2015 Annual Report Download - page 14
Download and view the complete annual report
Please find page 14 of the 2015 US Cellular annual report below. You can navigate through the pages in the report by either clicking on the pages listed below, or by using the keyword search tool below to find specific information within the annual report.-
 1
1 -
2
-
3
-
 4
4 -
 5
5 -
 6
6 -
 7
7 -
 8
8 -
 9
9 -
 10
10 -
 11
11 -
 12
12 -
 13
13 -
 14
14 -
 15
15 -
 16
16 -
 17
17 -
 18
18 -
 19
19 -
 20
20 -
 21
21 -
 22
22 -
 23
23 -
 24
24 -
25
-
26
-
27
-
28
-
29
-
30
-
31
-
32
-
33
-
34
-
35
-
36
-
37
-
38
-
39
-
40
-
41
-
42
-
43
-
44
-
45
-
46
-
47
-
48
-
49
-
50
-
51
-
52
-
53
-
54
-
55
-
56
-
57
-
58
-
59
-
60
-
61
-
62
-
63
-
64
-
65
-
66
-
67
-
68
-
69
-
70
-
71
-
72
-
73
-
74
-
75
-
76
-
77
-
78
-
79
-
80
-
81
-
82
-
83
-
84
-
85
-
86
-
87
-
88
-
89
-
90
-
91
-
92
-
93
-
94
-
95
-
96
-
97
-
98
-
99
-
100
-
101
-
102
-
103
-
104
-
105
-
106
-
107
-
108
-
109
-
110
-
111
-
112
-
113
-
114
-
115
-
116
-
117
-
118
-
119
-
120
-
121
-
122
-
123
-
124
 |
 |

11MAR201618465519
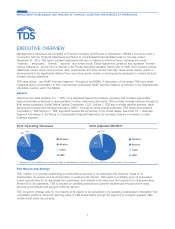
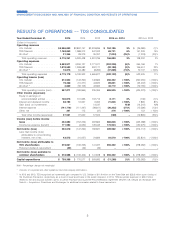
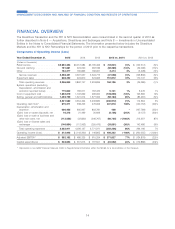
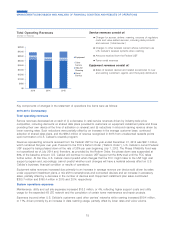
TDS’ 3% increase in operating revenues was driven by
Equipment sales revenues at U.S. Cellular due primarily to
an increasing number of customers choosing equipment
installment plans. Cable acquisitions completed in 2014
also contributed to the improvement.
Cable and HMS acquisitions completed in 2013 and 2014
drove the 2% increase in TDS’s operating revenues in
2014. This was partially offset by a decrease in U.S.
Cellular’s operating revenues which experienced a decline
in retail service revenue and inbound roaming and an
improvement in Equipment sales revenue due primarily to
the implementation of equipment installment plans on a
broad basis in 2014.
Refer to individual segment discussions in this MD&A for
additional details on operating revenues at the segment
$0
$1,000
$2,000
$3,000
$4,000
$5,000
$6,000
2013 2014 2015
All Other
TDS Telecom
U.S. Cellular
level.
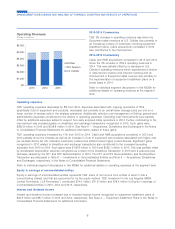
Operating expenses
TDS’ operating expenses decreased by 8% from 2014. Expenses associated with ongoing operations of TDS,
specifically Cost of equipment and products, decreased due primarily to an overall lower average price per unit on a
fewer number of devices sold in the wireless operations. Additionally, effective cost management of Selling, general and
administrative expenses contributed to the decline in operating expenses. Operating cost improvements were partially
offset by additional expenses added to support the newly acquired cable operations in 2014. Further contributing to the
improvement was increased gains on divestiture and exchange transactions recognized in 2015. Such gains were
$282.8 million in 2015 and $128.8 million in 2014. See Note 6 — Acquisitions, Divestitures and Exchanges in the Notes
to Consolidated Financial Statements for additional information related to these gains.
TDS’ operating expenses increased by 11% from 2013 to 2014. Cable and HMS acquisitions completed in 2013 and
2014 partially drove the increase as well as an increase in Cost of equipment and products associated with higher cost
per wireless device as U.S. Cellular’s customers’ preferences shifted toward higher priced devices. Significant gains
recognized in 2013 related to divestiture and exchange transactions also contributed to the increased operating
expenses from 2013 to 2014. Such gains were $128.8 million in 2014 and $556.1 million in 2013. This was partially offset
by accelerated depreciation expense recognized as a result of the Divestiture Transaction in 2013 and a year-over-year
decrease caused by the NY1 and NY2 Deconsolidation in 2013. The NY1 and NY2 Deconsolidation and the Divestiture
Transaction are discussed in Note 8 — Investments in Unconsolidated Entities and Note 6 — Acquisitions, Divestitures
and Exchanges, respectively, in the Notes to Consolidated Financial Statements.
Refer to individual segment discussions in this MD&A for additional details on operating expenses at the segment level.
Equity in earnings of unconsolidated entities
Equity in earnings of unconsolidated entities represents TDS’ share of net income from entities in which it has a
noncontrolling interest and that are accounted for by the equity method. TDS’ investment in the Los Angeles SMSA
Limited Partnership (‘‘LA Partnership’’) contributed $74.0 million, $71.8 million and $78.4 million to Equity in earnings of
unconsolidated entities in 2015, 2014 and 2013, respectively.
Interest and dividend income
Interest and dividend income increased due to imputed interest income recognized on equipment installment plans of
$33.9 million and $8.7 million in 2015 and 2014, respectively. See Note 3 — Equipment Installment Plans in the Notes to
Consolidated Financial Statements for additional information.
6
MANAGEMENT’S DISCUSSION AND ANALYSIS OF FINANCIAL CONDITION AND RESULTS OF OPERATIONS
2015-2014 Commentary
2014-2013 Commentary
Operating Revenues
(Dollars in millions)