US Cellular 2015 Annual Report Download - page 113
Download and view the complete annual report
Please find page 113 of the 2015 US Cellular annual report below. You can navigate through the pages in the report by either clicking on the pages listed below, or by using the keyword search tool below to find specific information within the annual report.-
 1
1 -
2
-
3
-
4
-
5
-
6
-
7
-
8
-
9
-
10
-
11
-
12
-
13
-
14
-
15
-
16
-
17
-
18
-
19
-
20
-
21
-
22
-
23
-
24
-
25
-
26
-
27
-
28
-
29
-
30
-
31
-
32
-
33
-
34
-
35
-
36
-
37
-
38
-
39
-
40
-
41
-
42
-
43
-
44
-
45
-
46
-
47
-
48
-
49
-
50
-
51
-
52
-
53
-
54
-
55
-
56
-
57
-
58
-
59
-
60
-
61
-
62
-
63
-
64
-
65
-
66
-
67
-
68
-
69
-
70
-
71
-
72
-
73
-
74
-
75
-
76
-
77
-
78
-
79
-
80
-
81
-
82
-
83
-
84
-
85
-
86
-
87
-
88
-
89
-
90
-
91
-
92
-
93
-
94
-
95
-
96
-
97
-
98
-
99
-
100
-
101
-
102
-
 103
103 -
 104
104 -
 105
105 -
 106
106 -
 107
107 -
 108
108 -
 109
109 -
 110
110 -
 111
111 -
 112
112 -
 113
113 -
 114
114 -
 115
115 -
 116
116 -
 117
117 -
 118
118 -
 119
119 -
 120
120 -
 121
121 -
 122
122 -
 123
123 -
124
 |
 |

TDS Telecom
TDS TDS Corporate,
U.S. Telecom Telecom Eliminations
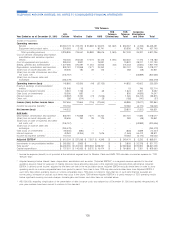
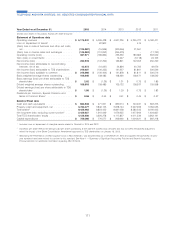
Year Ended or as of December 31, 2013 Cellular Wireline Cable HMS Eliminations Total and Other Total
(Dollars in thousands)
Operating revenues
Service ....................$3,594,773 $ 723,372 $ 35,883 $ 94,875 $(1,063) $ 853,067 $ (4,349) $4,443,491
Equipment and product sales ....... 324,063 3,195 – 90,741 – 93,936 39,746 457,745
Total operating revenues ........ 3,918,836 726,567 35,883 185,616 (1,063) 947,003 35,397 4,901,236
Cost of services (excluding Depreciation,
amortization and accretion reported
below) ..................... 763,435 266,635 17,274 60,423 (1,000) 343,332 11,416 1,118,183
Cost of equipment and products ...... 999,000 3,831 – 75,991 – 79,822 28,311 1,107,133
Selling, general and administrative ..... 1,677,395 220,097 11,054 44,945 (63) 276,033 (5,650) 1,947,778
Depreciation, amortization and accretion . . 803,781 170,868 7,571 24,262 – 202,701 11,595 1,018,077
(Gain) loss on asset disposals, net ..... 30,606 130 28 125 – 283 (48) 30,841
(Gain) loss on sale of business and other
exit costs, net ................ (246,767) – – – – – (53,889) (300,656)
(Gain) loss on license sales and
exchanges .................. (255,479) – – – – – – (255,479)
Operating income (loss) .......... 146,865 65,006 (44) (20,130) – 44,832 43,662 235,359
Equity in earnings of unconsolidated
entities .................... 131,949 19 – – – 19 746 132,714
Interest and dividend income ........ 3,961 1,759 2 63 – 1,824 3,307 9,092
Gain (loss) on investments.......... 18,556 830 – – – 830 (4,839) 14,547
Interest expense ................ (43,963) 3,265 (74) (1,626) – 1,565 (56,413) (98,811)
Other, net .................... 288 (214) – 29 – (185) (140) (37)
Income (loss) before income taxes . . . 257,656 70,665 (116) (21,664) – 48,885 (13,677) 292,864
Income tax expense (benefit)1........ 113,134 19,084 (6,175) 126,043
Net income (loss) .............. 144,522 29,801 (7,502) 166,821
Add back:
Depreciation, amortization and accretion . . 803,781 170,868 7,571 24,262 – 202,701 11,595 1,018,077
(Gain) loss on asset disposals, net ..... 30,606 130 28 125 – 283 (48) 30,841
(Gain) loss on sale of business and other
exit costs, net ................ (246,767) – – – – – (53,889) (300,656)
(Gain) loss on license sales and
exchanges .................. (255,479) – – – – – – (255,479)
Gain (loss) on investments.......... (18,556) (830) – – – (830) 4,839 (14,547)
Interest expense ................ 43,963 (3,265) 74 1,626 – (1,565) 56,413 98,811
Income tax expense (benefit)1........ 113,134 19,084 (6,175) 126,043
Adjusted EBITDA2..............$ 615,204 $ 237,568 $ 7,557 $ 4,349 $ – $ 249,474 $ 5,233 $ 869,911
Investments in unconsolidated entities . . . $ 265,585 $ 3,809 $ – $ – $ – $ 3,809 $ 32,378 $ 301,772
Total assets3..................$6,430,255 $1,452,502 $278,969 $328,397 $ – $2,059,868 $370,905 $8,861,028
Capital expenditures ..............$ 737,501 $ 140,009 $ 8,375 $ 16,474 $ – $ 164,858 $ 7,301 $ 909,660
1Income tax expense (benefit) is not provided at the individual segment level for Wireline, Cable and HMS. TDS calculates income tax expense for ‘‘TDS
Telecom Total’’.
2Adjusted earnings before interest, taxes, depreciation, amortization and accretion (‘‘Adjusted EBITDA’’) is a segment measure reported to the chief
operating decision maker for purposes of making decisions about allocating resources to the segments and assessing their performance. Adjusted
EBITDA is defined as net income, adjusted for the items set forth in the reconciliation above. Adjusted EBITDA excludes these items in order to show
operating results on a more comparable basis from period to period. From time to time, TDS may also exclude other items from Adjusted EBITDA if
such items help reflect operating results on a more comparable basis. TDS does not intend to imply that any of such items that are excluded are
non-recurring, infrequent or unusual; such items may occur in the future. TDS believes Adjusted EBITDA is a useful measure of TDS’ operating results
before significant recurring non-cash charges, discrete gains and losses, and other items as indicated above.
3ASU 2015-03, regarding simplification of the presentation of debt issuance costs, was adopted as of December 31, 2015 and applied retrospectively. All
prior year numbers have been revised to conform to this standard.
105
TELEPHONE AND DATA SYSTEMS, INC. NOTES TO CONSOLIDATED FINANCIAL STATEMENTS