US Cellular 2015 Annual Report Download - page 52
Download and view the complete annual report
Please find page 52 of the 2015 US Cellular annual report below. You can navigate through the pages in the report by either clicking on the pages listed below, or by using the keyword search tool below to find specific information within the annual report.-
 1
1 -
2
-
3
-
4
-
5
-
6
-
7
-
8
-
9
-
10
-
11
-
12
-
13
-
14
-
15
-
16
-
17
-
18
-
19
-
20
-
21
-
22
-
23
-
24
-
25
-
26
-
27
-
28
-
29
-
30
-
31
-
32
-
33
-
34
-
35
-
36
-
37
-
38
-
39
-
40
-
41
-
 42
42 -
 43
43 -
 44
44 -
 45
45 -
 46
46 -
 47
47 -
 48
48 -
 49
49 -
 50
50 -
 51
51 -
 52
52 -
 53
53 -
 54
54 -
 55
55 -
 56
56 -
 57
57 -
 58
58 -
 59
59 -
 60
60 -
 61
61 -
 62
62 -
63
-
64
-
65
-
66
-
67
-
68
-
69
-
70
-
71
-
72
-
73
-
74
-
75
-
76
-
77
-
78
-
79
-
80
-
81
-
82
-
83
-
84
-
85
-
86
-
87
-
88
-
89
-
90
-
91
-
92
-
93
-
94
-
95
-
96
-
97
-
98
-
99
-
100
-
101
-
102
-
103
-
104
-
105
-
106
-
107
-
108
-
109
-
110
-
111
-
112
-
113
-
114
-
115
-
116
-
117
-
118
-
119
-
120
-
121
-
122
-
123
-
124
 |
 |

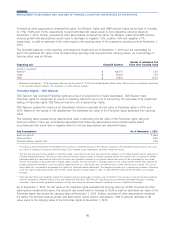
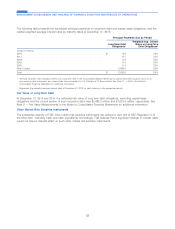
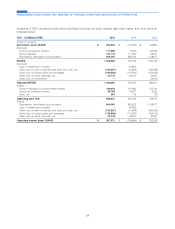
The Goodwill balance of U.S. Cellular and of each prior reporting unit at TDS as of November 1, 2015 and the
percentage by which the estimated fair value of the corresponding reporting units exceeded the carrying values, as a
percentage of carrying value, was as follows:
Goodwill balance at Excess of estimated Fair
Reporting Unit TDS1Value over Carrying Value
(Dollars in thousands)
Prior Reporting Units:
Central Region ..................................... $ 68,511 32.0%
Mid-Atlantic Region .................................. $ 114,351 0.6%
New England Region ................................. $ 17,473 20.8%
Northwest Region ................................... $ 26,516 32.1%
New Single Reporting Unit:
U.S. Cellular ....................................... $ 226,851 24.0%
1Previously under GAAP, TDS accounted for U.S. Cellular’s share repurchases as step acquisitions, allocating a portion of the share repurchase value to
TDS’ Goodwill. This resulted in a difference between U.S. Cellular’s Goodwill on a stand-alone basis and the TDS consolidated Goodwill related to U.S.
Cellular. TDS recorded subsequent activities relating to Goodwill, including impairments and divestiture activities, for both entities based on their
respective balances.
Goodwill – TDS Telecom
TDS Telecom has recorded Goodwill as a result of the acquisition of wireline, cable and HMS businesses. For purposes
of the 2015 and 2014 Goodwill impairment tests, TDS Telecom had three reporting units: Wireline, Cable and HMS.
Based on the results of the TDS Telecom annual Goodwill impairment assessment performed as of November 1, 2015,
the fair values of the Wireline, Cable and HMS reporting units exceeded their carrying values. Therefore, no impairment
of Goodwill existed for the reporting units.
The discounted cash flow approach and guideline public company method were used to value the Wireline, Cable and
HMS reporting units. The discounted cash flow approach uses value drivers and risks specific to the industry and
current economic factors. The most significant assumptions made in this process were the revenue growth rate (shown
as a compound annual growth rate in the table below), the terminal revenue growth rate and the discount rate. The
guideline public company method develops an indication of fair value by calculating average market pricing multiples for
selected publicly-traded companies. The developed multiples were applied to applicable financial measures of the
respective reporting unit to determine fair value. The discounted cash flow approach and guideline public company
method were weighted to arrive at the total fair value used for impairment testing. The weighting of methods was
consistently applied in both 2015 and 2014.
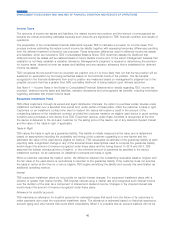
For purposes of the discounted cash flow approach, the following table represents key assumptions used in estimating
the fair value of the Wireline, Cable and HMS reporting units as of the testing date. There are uncertainties associated
with these key assumptions and potential events and/or circumstances that could have a negative effect on the key
assumptions described below.
As of November 1, 2015
Key Assumptions Wireline Cable HMS
Revenue growth rate1........................................ (2.3)% 8.3% 4.8%
Terminal revenue growth rate1................................... 0.0% 2.5% 2.5%
Discount rate2............................................ 6.5% 9.5% 11.5%
1There are risks that could negatively impact the projected revenue growth rates, including, but not limited to: the success of new and existing products/
services, competition, and operational difficulties. TDS Telecom’s reporting units use internally generated forecasts to develop such rates. These
internally generated forecasts consider such things as observed demand, market factors and competitive knowledge.
2The discount rate is dependent upon the cost of capital of other industry market participants and company specific risk. To the extent that the weighted
average cost of capital of industry participants increases, this would decrease the estimated fair value of the reporting units. The weighted average cost
of capital may increase if borrowing costs rise, market participants weight more of their capital structure towards equity vs. debt, Wireline, Cable or
HMS’ risk in relation to its peers increases or other elements affecting the estimated cost of equity increase.
44
MANAGEMENT’S DISCUSSION AND ANALYSIS OF FINANCIAL CONDITION AND RESULTS OF OPERATIONS