US Cellular 2015 Annual Report Download - page 22
Download and view the complete annual report
Please find page 22 of the 2015 US Cellular annual report below. You can navigate through the pages in the report by either clicking on the pages listed below, or by using the keyword search tool below to find specific information within the annual report.-
 1
1 -
2
-
3
-
4
-
5
-
6
-
7
-
8
-
9
-
10
-
11
-
 12
12 -
 13
13 -
 14
14 -
 15
15 -
 16
16 -
 17
17 -
 18
18 -
 19
19 -
 20
20 -
 21
21 -
 22
22 -
 23
23 -
 24
24 -
 25
25 -
 26
26 -
 27
27 -
 28
28 -
 29
29 -
 30
30 -
 31
31 -
 32
32 -
33
-
34
-
35
-
36
-
37
-
38
-
39
-
40
-
41
-
42
-
43
-
44
-
45
-
46
-
47
-
48
-
49
-
50
-
51
-
52
-
53
-
54
-
55
-
56
-
57
-
58
-
59
-
60
-
61
-
62
-
63
-
64
-
65
-
66
-
67
-
68
-
69
-
70
-
71
-
72
-
73
-
74
-
75
-
76
-
77
-
78
-
79
-
80
-
81
-
82
-
83
-
84
-
85
-
86
-
87
-
88
-
89
-
90
-
91
-
92
-
93
-
94
-
95
-
96
-
97
-
98
-
99
-
100
-
101
-
102
-
103
-
104
-
105
-
106
-
107
-
108
-
109
-
110
-
111
-
112
-
113
-
114
-
115
-
116
-
117
-
118
-
119
-
120
-
121
-
122
-
123
-
124
 |
 |

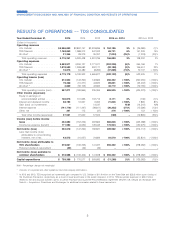
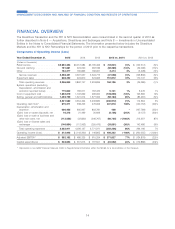
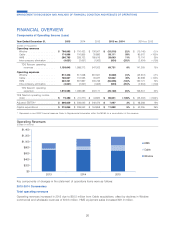
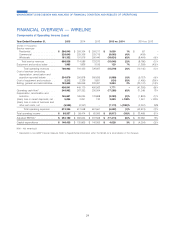
FINANCIAL OVERVIEW
The Divestiture Transaction and the NY1 & NY2 Deconsolidation were consummated in the second quarter of 2013 as
further described in Note 6 — Acquisitions, Divestitures and Exchanges and Note 8 — Investments in Unconsolidated
Entities in the Notes to Consolidated Financial Statements. The information presented below includes the Divestiture
Markets and the NY1 & NY2 Partnerships for the portion of 2013 prior to the respective transactions.
Components of Operating Income (Loss)
Year Ended December 31, 2015 2014 2013 2015 vs. 2014 2014 vs. 2013
(Dollars in thousands)
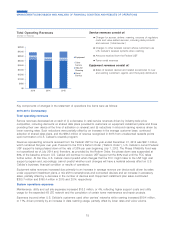
Retail service ............... $2,994,353 $3,012,984 $3,165,496 $ (18,631) (1)% $ (152,512) (5)%
Inbound roaming ............ 191,801 224,090 263,186 (32,289) (14)% (39,096) (15)%
Other ................... 164,277 160,863 166,091 3,414 2% (5,228) (3)%
Service revenues ........... 3,350,431 3,397,937 3,594,773 (47,506) (1)% (196,836) (5)%
Equipment sales ............ 646,422 494,810 324,063 151,612 31% 170,747 53%
Total operating revenues ...... 3,996,853 3,892,747 3,918,836 104,106 3% (26,089) (1)%
System operations (excluding
Depreciation, amortization and
accretion reported below) ..... 775,042 769,911 763,435 5,131 1% 6,476 1%
Cost of equipment sold ........ 1,052,810 1,192,669 999,000 (139,859) (12)% 193,669 19%
Selling, general and administrative . 1,493,730 1,591,914 1,677,395 (98,184) (6)% (85,481) (5)%
3,321,582 3,554,494 3,439,830 (232,912) (7)% 114,664 3%
Operating cash flow* .......... 675,271 338,253 479,006 337,018 100% (140,753) (29)%
Depreciation, amortization and
accretion ................ 606,455 605,997 803,781 458 – (197,784) (25)%
(Gain) loss on asset disposals, net . 16,313 21,469 30,606 (5,156) (24)% (9,137) (30)%
(Gain) loss on sale of business and
other exit costs, net ......... (113,555) (32,830) (246,767) (80,725) >(100)% 213,937 87%
(Gain) loss on license sales and
exchanges ............... (146,884) (112,993) (255,479) (33,891) (30)% 142,486 56%
Total operating expenses ...... 3,683,911 4,036,137 3,771,971 (352,226) (9)% 264,166 7%
Operating income (loss) ........ $ 312,942 $ (143,390) $ 146,865 $ 456,332 >100% $ (290,255) >(100)%
Adjusted EBITDA* ........... $ 852,152 $ 480,325 $ 615,204 $ 371,827 77% $ (134,879) (22)%
Capital expenditures .......... $ 533,053 $ 557,615 $ 737,501 $ (24,562) (4)% $ (179,886) (24)%
* Represents a non-GAAP financial measure. Refer to Supplemental Information within this MD&A for a reconciliation of this measure.
14
MANAGEMENT’S DISCUSSION AND ANALYSIS OF FINANCIAL CONDITION AND RESULTS OF OPERATIONS