UPS 2011 Annual Report Download - page 99
Download and view the complete annual report
Please find page 99 of the 2011 UPS annual report below. You can navigate through the pages in the report by either clicking on the pages listed below, or by using the keyword search tool below to find specific information within the annual report.-
 1
1 -
2
-
3
-
4
-
5
-
6
-
7
-
8
-
9
-
10
-
11
-
12
-
13
-
14
-
15
-
16
-
17
-
18
-
19
-
20
-
21
-
22
-
23
-
24
-
25
-
26
-
27
-
28
-
29
-
30
-
31
-
32
-
33
-
34
-
35
-
36
-
37
-
38
-
39
-
40
-
41
-
42
-
43
-
44
-
45
-
46
-
47
-
48
-
49
-
50
-
51
-
52
-
53
-
54
-
55
-
56
-
57
-
58
-
59
-
60
-
61
-
62
-
63
-
64
-
65
-
66
-
67
-
68
-
69
-
70
-
71
-
72
-
73
-
74
-
75
-
76
-
77
-
78
-
79
-
80
-
81
-
82
-
83
-
84
-
85
-
86
-
87
-
88
-
 89
89 -
 90
90 -
 91
91 -
 92
92 -
 93
93 -
 94
94 -
 95
95 -
 96
96 -
 97
97 -
 98
98 -
 99
99 -
 100
100 -
 101
101 -
 102
102 -
 103
103 -
 104
104 -
 105
105 -
 106
106 -
 107
107 -
 108
108 -
 109
109 -
110
-
111
-
112
-
113
-
114
-
115
-
116
-
117
-
118
-
119
-
120
-
121
-
122
-
123
-
124
-
125
-
126
-
127
-
128
-
129
-
130
-
131
-
132
-
133
-
134
-
135
-
136
-
137
-
138
-
139
-
140
-
141
-
142
-
143
-
144
-
145
-
146
-
147
-
148
 |
 |

UNITED PARCEL SERVICE, INC. AND SUBSIDIARIES
NOTES TO CONSOLIDATED FINANCIAL STATEMENTS—(Continued)
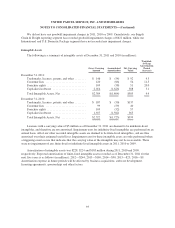
asset values as of December 31. These assets are primarily invested in a portfolio of diversified, direct
investments and funds of hedge funds. Real estate investments and private equity funds are valued using fair
values per the most recent partnership audited financial reports, adjusted as appropriate for any lag between the
date of the financial reports and December 31. The real estate investments consist of U.S. and non-U.S. real
estate investments and are broadly diversified. The fair values may, due to the inherent uncertainty of valuation
for those alternative investments, differ significantly from the values that would have been used had a ready
market for the alternative investments existed, and the differences could be material.
At December 31, 2011 and 2010, $3.895 and $3.766 billion of plan assets are held in commingled stock
funds that hold U.S. and international public market securities. The plans held the right to liquidate positions in
these commingled stock funds at any time, subject only to a brief notification period. No unfunded commitments
existed with respect to these commingled stock funds at December 31, 2011.
The plans hold $2.302 and $2.098 billion of investments in limited partnership interests in various private
equity and real estate funds. Limited provision exists for the redemption of these interests by the general partners
that invest in these funds until the end of the term of the partnerships, typically ranging between 12 and 18 years
from the date of inception. An active secondary market exists for similar partnership interests, although no
particular value (discount or premium) can be guaranteed. At December 31, 2011, unfunded commitments to
such limited partnerships totaling approximately $701 million are expected to be contributed over the remaining
investment period, typically ranging between three and six years.
At December 31, 2011 and 2010, $2.743 and $2.023 billion of plan investments are held in hedge funds that
pursue multiple strategies to diversify risk and reduce volatility. Most of these funds allow redemptions either
quarterly or semi-annually after a two to three month notice period, while other funds allow for redemption after
only a brief notification period with no restriction on redemption frequency. No unfunded commitments existed
with respect to these hedge funds as of December 31, 2011.
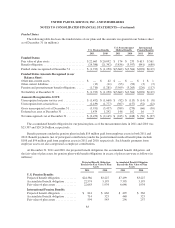
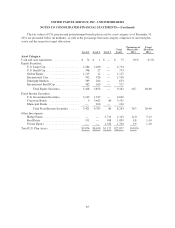
The following tables presents the changes in the Level 3 instruments measured on a recurring basis for the
years ended December 31, 2011 and 2010 (in millions):
Corporate
Bonds
Hedge
Funds
Real
Estate
Private
Equity Total
Balance on January 1, 2010 .............................. $201 $1,284 $ 550 $1,145 $3,180
Actual Return on Assets:
Assets Held at End of Year ........................... (5) 129 100 177 401
Assets Sold During the Year .......................... 13 10 — 1 24
Purchases ............................................ 41 711 152 149 1,053
Sales ................................................ (57) (111) (13) (163) (344)
Settlements ........................................... — — — — —
Transfers Into (Out of) Level 3 ............................ — — — — —
Balance on December 31, 2010 ........................... $193 $2,023 $ 789 $1,309 $4,314
Actual Return on Assets:
Assets Held at End of Year ........................... (14) 122 144 145 397
Assets Sold During the Year .......................... 3 22 5 — 30
Purchases ............................................ 57 757 150 164 1,128
Sales ................................................ (159) (181) (140) (264) (744)
Settlements ........................................... — — — — —
Transfers Into (Out of) Level 3 ............................ — — — — —
Balance on December 31, 2011 ........................... $ 80 $2,743 $ 948 $1,354 $5,125
87