UPS 2011 Annual Report Download - page 3
Download and view the complete annual report
Please find page 3 of the 2011 UPS annual report below. You can navigate through the pages in the report by either clicking on the pages listed below, or by using the keyword search tool below to find specific information within the annual report.-
 1
1 -
 2
2 -
 3
3 -
 4
4 -
 5
5 -
 6
6 -
 7
7 -
 8
8 -
 9
9 -
 10
10 -
 11
11 -
 12
12 -
 13
13 -
 14
14 -
15
-
16
-
17
-
18
-
19
-
20
-
21
-
22
-
23
-
24
-
25
-
26
-
27
-
28
-
29
-
30
-
31
-
32
-
33
-
34
-
35
-
36
-
37
-
38
-
39
-
40
-
41
-
42
-
43
-
44
-
45
-
46
-
47
-
48
-
49
-
50
-
51
-
52
-
53
-
54
-
55
-
56
-
57
-
58
-
59
-
60
-
61
-
62
-
63
-
64
-
65
-
66
-
67
-
68
-
69
-
70
-
71
-
72
-
73
-
74
-
75
-
76
-
77
-
78
-
79
-
80
-
81
-
82
-
83
-
84
-
85
-
86
-
87
-
88
-
89
-
90
-
91
-
92
-
93
-
94
-
95
-
96
-
97
-
98
-
99
-
100
-
101
-
102
-
103
-
104
-
105
-
106
-
107
-
108
-
109
-
110
-
111
-
112
-
113
-
114
-
115
-
116
-
117
-
118
-
119
-
120
-
121
-
122
-
123
-
124
-
125
-
126
-
127
-
128
-
129
-
130
-
131
-
132
-
133
-
134
-
135
-
136
-
137
-
138
-
139
-
140
-
141
-
142
-
143
-
144
-
145
-
146
-
147
-
148
 |
 |

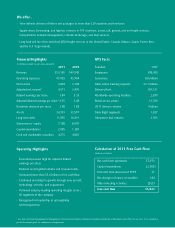
Calculation of 2011 Free Cash Flow
(millions of dollars)
Founded: 1907
Employees: 398,300
Customers: 8.8 million
Daily online tracking requests: 32.1 million
Delivery fleet: 101,121
Worldwide operating facilities: 2,879
Retail access points: 61,700
2011 delivery volume: 4 billion
Daily flight segments: 1,827
Alternative fuel vehicles: 2,593
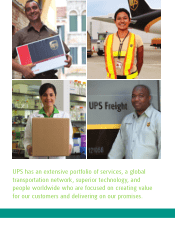
• Time-definitedeliveryoflettersandpackagestomorethan220countriesandterritories.
• Supplychain,forwarding,andlogisticsservicesin195countries;ocean,rail,ground,andairfreightservices;
transportationnetworkmanagement;customsbrokerage;andmailservices.
• Long-haulandless-than-truckload(LTL)freightservicesintheUnitedStates,Canada,Mexico,Guam,PuertoRico,
andtheU.S.VirginIslands.
• Exceededprevioushighforadjusteddiluted
earnings per share.
• Realizedrecordglobalvolumeandrevenuelevels.
• Generatedmorethan$5.0billioninfreecashflow.
• Continuedinvestingforgrowththroughnewaircraft,
technology, vehicles, and acquisitions.
• Achievedindustry-leadingoperatingmarginsacross
all segments of the company.
• Recognizedforleadershipinsustainability
and transparency.
Operating Highlights
2011 2010
Revenue $53,105 $49,545
Operatingexpenses 47,025 43,904
Net income 3,804 3,338
Adjustednetincome* 4,311 3,495
Diluted earnings per share 3.84 3.33
Adjusteddilutedearningspershare*4.35 3.48
Dividends declared per share 2.08 1.88
Assets 34,701 33,597
Long-termdebt 11,095 10,491
Shareowners’equity 7,108 8,047
Capitalexpenditures 2,005 1,389
Cash and marketable securities 4,275 4,081
Financial Highlights
(inmillionsexceptforper-shareamounts)
UPS Facts
We offer...
Netcashfromoperations $7,073
Capitalexpenditures (2,005)
ProceedsfromdisposalsofPP&E 27
Net change in finance receivables 184
Other investing activities (257)
Free cash flow $5,022
* See Items Affecting Comparability in Management’s Discussion and Analysis of Financial Condition and Results of Operations under Part II of our Form 10-K, included as
part of this annual report, for explanations of adjustments.