UPS 2011 Annual Report Download - page 48
Download and view the complete annual report
Please find page 48 of the 2011 UPS annual report below. You can navigate through the pages in the report by either clicking on the pages listed below, or by using the keyword search tool below to find specific information within the annual report.-
 1
1 -
2
-
3
-
4
-
5
-
6
-
7
-
8
-
9
-
10
-
11
-
12
-
13
-
14
-
15
-
16
-
17
-
18
-
19
-
20
-
21
-
22
-
23
-
24
-
25
-
26
-
27
-
28
-
29
-
30
-
31
-
32
-
33
-
34
-
35
-
36
-
37
-
 38
38 -
 39
39 -
 40
40 -
 41
41 -
 42
42 -
 43
43 -
 44
44 -
 45
45 -
 46
46 -
 47
47 -
 48
48 -
 49
49 -
 50
50 -
 51
51 -
 52
52 -
 53
53 -
 54
54 -
 55
55 -
 56
56 -
 57
57 -
 58
58 -
59
-
60
-
61
-
62
-
63
-
64
-
65
-
66
-
67
-
68
-
69
-
70
-
71
-
72
-
73
-
74
-
75
-
76
-
77
-
78
-
79
-
80
-
81
-
82
-
83
-
84
-
85
-
86
-
87
-
88
-
89
-
90
-
91
-
92
-
93
-
94
-
95
-
96
-
97
-
98
-
99
-
100
-
101
-
102
-
103
-
104
-
105
-
106
-
107
-
108
-
109
-
110
-
111
-
112
-
113
-
114
-
115
-
116
-
117
-
118
-
119
-
120
-
121
-
122
-
123
-
124
-
125
-
126
-
127
-
128
-
129
-
130
-
131
-
132
-
133
-
134
-
135
-
136
-
137
-
138
-
139
-
140
-
141
-
142
-
143
-
144
-
145
-
146
-
147
-
148
 |
 |
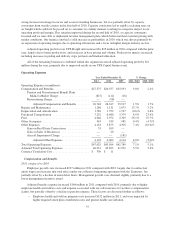
and 3.5% for drivers and dock workers in our pick-up and delivery network. These expense increases were
somewhat offset by improved productivity measures, including pick-up and delivery stops per hour, dock bills
per hour and improved linehaul network utilization.
Expenses for the other businesses within Supply Chain & Freight increased $6 million in 2011 compared to
2010, and the increases were spread among several operating expense categories and business units.
2010 compared to 2009
Forwarding and logistics adjusted operating expenses increased $697 million in 2010 compared with 2009,
due to several factors. Purchased transportation costs increased by $843 million in 2010, largely due to a strong
increase in tonnage in our air and ocean forwarding businesses, as well as rapidly escalating rates on air freight
due to capacity constraints from outside carriers in the first half of 2010. The capacity constraints in the air
freight business began to recede in the second half of 2010, and the increases in purchased transportation costs
lessened. Cost controls partly offset the purchased transportation expense growth, as total compensation and
benefits expense declined $73 million and other occupancy expense declined by $23 million, among other
factors. The decrease in compensation and benefits expense was impacted by reduced pension expense, while the
decline in other occupancy expense was largely due to lower rent expense on warehouses and other facilities.
Freight adjusted operating expenses increased $240 million in 2010 compared with 2009, while the total
cost per LTL shipment increased 8.8% for year. The two largest components of this increase relate to the cost of
operating our linehaul network which increased $73 million in 2010 compared with 2009, and pick-up, delivery
and dock costs which increased $98 million for the year. We incurred higher fuel costs operating our vehicle
fleet, as well as higher fuel surcharge rates passed to us from outside transportation carriers, as a result of higher
diesel fuel prices and increased volume. Additionally, compensation and benefit costs increased primarily as a
result of higher pension and health care costs, and effective wage increases of 2.0% for drivers in our linehaul
network and 3.3% for drivers and dock workers in our pick-up and delivery network. These expense increases
were somewhat offset by improved productivity measures, including pick-up and delivery stops per hour, dock
bills per hour and improved linehaul network utilization.
Adjusted operating expenses for the other businesses within Supply Chain & Freight increased by $12
million for 2010 compared with 2009, largely due to a gain recorded in 2009 (recorded as a reduction to
operating expenses) on the sale of substantially all our international Mail Boxes Etc. operations.
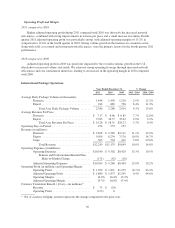
Operating Profit and Margin
2011 compared to 2010
The forwarding and logistics unit experienced an $80 million increase in adjusted operating profit in 2011
compared with 2010, largely due to revenue management initiatives and cost containment in our forwarding unit,
which improved operating leverage. Additionally, excess market capacity, especially in the Asia-to-U.S. trade
lane, reduced our purchased transportation costs and improved the operating profitability in this business. Our
logistics business had a small decrease in operating profit in 2011, primarily due to our continued investment in
expanding our global health care capabilities.
Our freight unit had an increase of $38 million in adjusted operating profit in 2011 compared with 2010,
primarily due to increased yields, volume growth and improved productivity in our operations.
The combined operating income for all of our other businesses in this segment increased $27 million in
2011, primarily due to improved results at our UPS Capital unit.
2010 compared to 2009
Adjusted operating profit in the forwarding and logistics units increased by $245 million in 2010 compared
with 2009 as a result of several factors. The operating profit increase in the forwarding unit was largely due to a
36