UPS 2011 Annual Report Download - page 42
Download and view the complete annual report
Please find page 42 of the 2011 UPS annual report below. You can navigate through the pages in the report by either clicking on the pages listed below, or by using the keyword search tool below to find specific information within the annual report.-
 1
1 -
2
-
3
-
4
-
5
-
6
-
7
-
8
-
9
-
10
-
11
-
12
-
13
-
14
-
15
-
16
-
17
-
18
-
19
-
20
-
21
-
22
-
23
-
24
-
25
-
26
-
27
-
28
-
29
-
30
-
31
-
 32
32 -
 33
33 -
 34
34 -
 35
35 -
 36
36 -
 37
37 -
 38
38 -
 39
39 -
 40
40 -
 41
41 -
 42
42 -
 43
43 -
 44
44 -
 45
45 -
 46
46 -
 47
47 -
 48
48 -
 49
49 -
 50
50 -
 51
51 -
 52
52 -
53
-
54
-
55
-
56
-
57
-
58
-
59
-
60
-
61
-
62
-
63
-
64
-
65
-
66
-
67
-
68
-
69
-
70
-
71
-
72
-
73
-
74
-
75
-
76
-
77
-
78
-
79
-
80
-
81
-
82
-
83
-
84
-
85
-
86
-
87
-
88
-
89
-
90
-
91
-
92
-
93
-
94
-
95
-
96
-
97
-
98
-
99
-
100
-
101
-
102
-
103
-
104
-
105
-
106
-
107
-
108
-
109
-
110
-
111
-
112
-
113
-
114
-
115
-
116
-
117
-
118
-
119
-
120
-
121
-
122
-
123
-
124
-
125
-
126
-
127
-
128
-
129
-
130
-
131
-
132
-
133
-
134
-
135
-
136
-
137
-
138
-
139
-
140
-
141
-
142
-
143
-
144
-
145
-
146
-
147
-
148
 |
 |

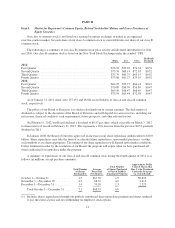
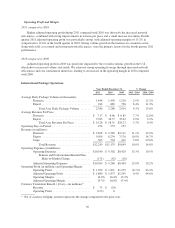
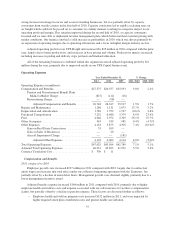
Operating Profit and Margin
2011 compared to 2010
Higher adjusted operating profit during 2011 compared with 2010 was driven by the increased network
efficiencies, combined with strong improvements in revenue per piece and a small increase in volume. Fourth
quarter 2011 adjusted operating profit was particularly strong, with adjusted operating margins of 15.2% in
comparison to 12.6% in the fourth quarter of 2010. Strong volume growth in the business-to-consumer sector,
along with solid cost control and strong network efficiencies, were the primary factors for the fourth quarter 2011
performance.
2010 compared to 2009
Adjusted operating profit in 2010 was positively impacted by the overall economic growth in the U.S.,
which drove increased volume and yields. We achieved strong operating leverage through increased network
efficiencies and cost containment initiatives, leading to an increase in the operating margin in 2010 compared
with 2009.
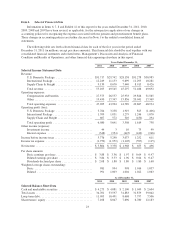
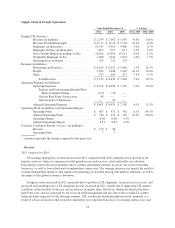
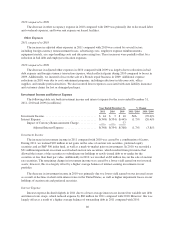
International Package Operations
Year Ended December 31, % Change
2011 2010 2009 2011 / 2010 2010 / 2009
Average Daily Package Volume (in thousands):
Domestic ............................... 1,444 1,403 1,218 2.9% 15.2%
Export ................................. 942 885 796 6.4% 11.2%
Total Avg. Daily Package Volume ....... 2,386 2,288 2,014 4.3% 13.6%
Average Revenue Per Piece:
Domestic ............................... $ 7.17 $ 6.66 $ 6.85 7.7% (2.8)%
Export ................................. 37.85 36.77 35.63 2.9% 3.2%
Total Avg. Revenue Per Piece ........... $ 19.28 $ 18.31 $18.23 5.3% 0.4%
Operating Days in Period ........................... 254 253 253
Revenue (in millions):
Domestic ............................... $ 2,628 $ 2,365 $2,111 11.1% 12.0%
Export ................................. 9,056 8,234 7,176 10.0% 14.7%
Cargo .................................. 565 534 412 5.8% 29.6%
Total Revenue ....................... $12,249 $11,133 $9,699 10.0% 14.8%
Operating Expenses (in millions):
Operating Expenses ....................... $10,540 $ 9,302 $8,420 13.3% 10.5%
Pension and Postretirement Benefit Plan
Mark-to-Market Charge .............. (171) (42) (16)
Adjusted Operating Expenses ............... $10,369 $ 9,260 $8,404 12.0% 10.2%
Operating Profit (in millions) and Operating Margin:
Operating Profit .......................... $ 1,709 $ 1,831 $1,279 (6.7)% 43.2%
Adjusted Operating Profit .................. $ 1,880 $ 1,873 $1,295 0.4% 44.6%
Operating Margin ......................... 14.0% 16.4% 13.2%
Adjusted Operating Margin ................. 15.3% 16.8% 13.4%
Currency Translation Benefit / (Cost)—(in millions)*:
Revenue ................................ $ 75 $ (24)
Operating Profit .......................... (123) 6
* Net of currency hedging; amount represents the change compared to the prior year.
30