UPS 2011 Annual Report Download - page 37
Download and view the complete annual report
Please find page 37 of the 2011 UPS annual report below. You can navigate through the pages in the report by either clicking on the pages listed below, or by using the keyword search tool below to find specific information within the annual report.-
 1
1 -
2
-
3
-
4
-
5
-
6
-
7
-
8
-
9
-
10
-
11
-
12
-
13
-
14
-
15
-
16
-
17
-
18
-
19
-
20
-
21
-
22
-
23
-
24
-
25
-
26
-
 27
27 -
 28
28 -
 29
29 -
 30
30 -
 31
31 -
 32
32 -
 33
33 -
 34
34 -
 35
35 -
 36
36 -
 37
37 -
 38
38 -
 39
39 -
 40
40 -
 41
41 -
 42
42 -
 43
43 -
 44
44 -
 45
45 -
 46
46 -
 47
47 -
48
-
49
-
50
-
51
-
52
-
53
-
54
-
55
-
56
-
57
-
58
-
59
-
60
-
61
-
62
-
63
-
64
-
65
-
66
-
67
-
68
-
69
-
70
-
71
-
72
-
73
-
74
-
75
-
76
-
77
-
78
-
79
-
80
-
81
-
82
-
83
-
84
-
85
-
86
-
87
-
88
-
89
-
90
-
91
-
92
-
93
-
94
-
95
-
96
-
97
-
98
-
99
-
100
-
101
-
102
-
103
-
104
-
105
-
106
-
107
-
108
-
109
-
110
-
111
-
112
-
113
-
114
-
115
-
116
-
117
-
118
-
119
-
120
-
121
-
122
-
123
-
124
-
125
-
126
-
127
-
128
-
129
-
130
-
131
-
132
-
133
-
134
-
135
-
136
-
137
-
138
-
139
-
140
-
141
-
142
-
143
-
144
-
145
-
146
-
147
-
148
 |
 |

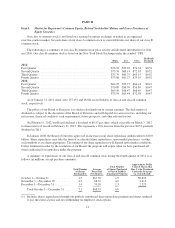
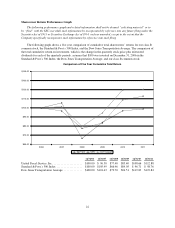
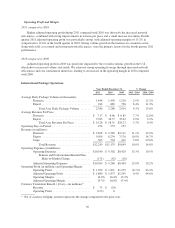
Our consolidated results are presented in the table below:
Year Ended December 31, % Change
2011 2010 2009 2011 / 2010 2010 / 2009
Revenue (in millions) ......................... $53,105 $49,545 $45,297 7.2% 9.4%
Operating Expenses (in millions) ................ 47,025 43,904 41,789 7.1% 5.1%
Operating Profit (in millions) ................... $ 6,080 $ 5,641 $ 3,508 7.8% 60.8%
Operating Margin ............................. 11.4% 11.4% 7.7%
Average Daily Package Volume (in thousands) ..... 15,797 15,574 15,064 1.4% 3.4%
Average Revenue Per Piece ..................... $ 10.82 $ 10.24 $ 9.83 5.7% 4.2%
Net Income (in millions) ....................... $ 3,804 $ 3,338 $ 1,968 14.0% 69.6%
Basic Earnings Per Share ....................... $ 3.88 $ 3.36 $ 1.97 15.5% 70.6%
Diluted Earnings Per Share ..................... $ 3.84 $ 3.33 $ 1.96 15.3% 69.9%
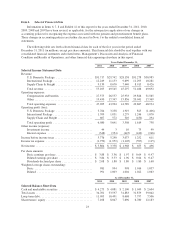
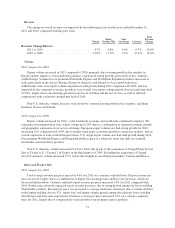
Items Affecting Comparability
The year-over-year comparisons of our financial results are affected by the following items (in millions):
Year Ended December 31,
2011 2010 2009
Operating Expenses:
Pension and Postretirement Benefit Plans Mark-to-Market
Charge ........................................... $827 $112 $ 16
Restructuring Charge ................................. — 98 —
Gain on Sales of Businesses ............................ — (20) —
Gains on Real Estate Transactions ....................... (33) (109) —
Aircraft Impairment Charge ............................ — — 181
Interest Expense:
Currency Remeasurement Charge ....................... — — 77
Income Tax Expense (Benefit) from the Items Above ............ (287) — (99)
Charge for Change in Tax Filing Status for German Subsidiary .... — 76 —
Pension and Postretirement Benefit Plans Mark-to-Market Charge
In 2011, 2010 and 2009, we incurred pre-tax mark-to-market losses on our pension and postretirement
benefit plans related to the remeasurement of plan assets and liabilities recognized outside of a 10% corridor of
$827, $112 and $16 million, respectively, on a consolidated basis ($527, $75 and $11 million after-tax,
respectively). These mark-to-market losses for 2011, 2010 and 2009 primarily resulted from decreases in the
discount rates used to value our projected benefit obligations in each year. These charges impacted each of our
three reporting segments in 2011 and 2010, and our International Package segment in 2009.
Restructuring Charge
In 2010, we streamlined the management structure in our U.S. Domestic Package segment, and incurred a
restructuring charge associated with this reorganization. This pre-tax charge totaled $98 million ($64 million
after-tax), and reflects the value of voluntary retirement benefits, severance benefits and unvested stock
compensation.
Gain on Sales of Businesses
In 2010, we sold our UPS Logistics Technologies business unit within our Supply Chain & Freight segment,
and recognized a pre-tax gain of $71 million ($44 million after-tax). Also in 2010, we sold a specialized
25