UPS 2011 Annual Report Download - page 89
Download and view the complete annual report
Please find page 89 of the 2011 UPS annual report below. You can navigate through the pages in the report by either clicking on the pages listed below, or by using the keyword search tool below to find specific information within the annual report.-
 1
1 -
2
-
3
-
4
-
5
-
6
-
7
-
8
-
9
-
10
-
11
-
12
-
13
-
14
-
15
-
16
-
17
-
18
-
19
-
20
-
21
-
22
-
23
-
24
-
25
-
26
-
27
-
28
-
29
-
30
-
31
-
32
-
33
-
34
-
35
-
36
-
37
-
38
-
39
-
40
-
41
-
42
-
43
-
44
-
45
-
46
-
47
-
48
-
49
-
50
-
51
-
52
-
53
-
54
-
55
-
56
-
57
-
58
-
59
-
60
-
61
-
62
-
63
-
64
-
65
-
66
-
67
-
68
-
69
-
70
-
71
-
72
-
73
-
74
-
75
-
76
-
77
-
78
-
 79
79 -
 80
80 -
 81
81 -
 82
82 -
 83
83 -
 84
84 -
 85
85 -
 86
86 -
 87
87 -
 88
88 -
 89
89 -
 90
90 -
 91
91 -
 92
92 -
 93
93 -
 94
94 -
 95
95 -
 96
96 -
 97
97 -
 98
98 -
 99
99 -
100
-
101
-
102
-
103
-
104
-
105
-
106
-
107
-
108
-
109
-
110
-
111
-
112
-
113
-
114
-
115
-
116
-
117
-
118
-
119
-
120
-
121
-
122
-
123
-
124
-
125
-
126
-
127
-
128
-
129
-
130
-
131
-
132
-
133
-
134
-
135
-
136
-
137
-
138
-
139
-
140
-
141
-
142
-
143
-
144
-
145
-
146
-
147
-
148
 |
 |

UNITED PARCEL SERVICE, INC. AND SUBSIDIARIES
NOTES TO CONSOLIDATED FINANCIAL STATEMENTS—(Continued)
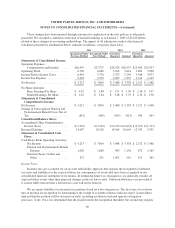
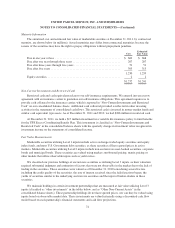
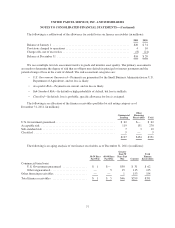
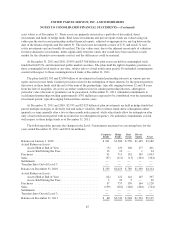
The following is a rollforward of the allowance for credit losses on finance receivables (in millions):
2011 2010
Balance at January 1 ..................................................... $20 $31
Provisions charged to operations ............................................ 4 10
Charge-offs, net of recoveries .............................................. (8) (21)
Balance at December 31 .................................................. $16 $20
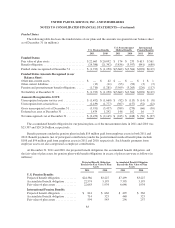
We use a multiple tier risk assessment matrix to grade and monitor asset quality. The primary assessments
are made to determine the degree of risk that an obligor may default in principal or interest payments and the
potential range of loss in the event of default. The risk assessment categories are:
•U.S. Government Guaranteed—Payments are guaranteed by the Small Business Administration or U.S.
Department of Agriculture, and no loss is likely.
•Acceptable Risk—Payments are current, and no loss is likely.
•Sub-Standard Risk—In default or high probability of default, but loss is unlikely.
•Classified—In default, loss is probable, specific allowance for loss is assigned.
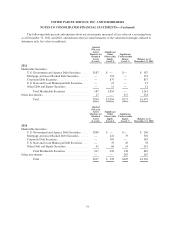
The following is an allocation of the finance receivables portfolio by risk rating category as of
December 31, 2011 (in millions):
Commercial
Lending
Other
Financing
Receivables Total
U.S. Government guaranteed ......................................... $ 62 $— $ 62
Acceptable risk ................................................... 119 151 270
Sub-standard risk .................................................. 7 3 10
Classified ........................................................ 9 — 9
$197 $154 $351
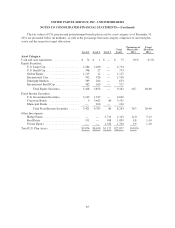
The following is an aging analysis of our finance receivables as of December 31, 2011 (in millions):
30-59 Days
Past Due
60-90 Days
Past Due
Greater
than 90
Days Past
Due Current
Total
Finance
Receivables
Commercial term loans:
U.S. Government guaranteed ................. $ 1 $— $30 $ 31 $ 62
Other unguaranteed ......................... — 5 15 115 135
Other financing receivables ...................... — — 1 153 154
Total finance receivables ........................ $ 1 $ 5 $46 $299 $351
77