UPS 2011 Annual Report Download - page 76
Download and view the complete annual report
Please find page 76 of the 2011 UPS annual report below. You can navigate through the pages in the report by either clicking on the pages listed below, or by using the keyword search tool below to find specific information within the annual report.-
 1
1 -
2
-
3
-
4
-
5
-
6
-
7
-
8
-
9
-
10
-
11
-
12
-
13
-
14
-
15
-
16
-
17
-
18
-
19
-
20
-
21
-
22
-
23
-
24
-
25
-
26
-
27
-
28
-
29
-
30
-
31
-
32
-
33
-
34
-
35
-
36
-
37
-
38
-
39
-
40
-
41
-
42
-
43
-
44
-
45
-
46
-
47
-
48
-
49
-
50
-
51
-
52
-
53
-
54
-
55
-
56
-
57
-
58
-
59
-
60
-
61
-
62
-
63
-
64
-
65
-
 66
66 -
 67
67 -
 68
68 -
 69
69 -
 70
70 -
 71
71 -
 72
72 -
 73
73 -
 74
74 -
 75
75 -
 76
76 -
 77
77 -
 78
78 -
 79
79 -
 80
80 -
 81
81 -
 82
82 -
 83
83 -
 84
84 -
 85
85 -
 86
86 -
87
-
88
-
89
-
90
-
91
-
92
-
93
-
94
-
95
-
96
-
97
-
98
-
99
-
100
-
101
-
102
-
103
-
104
-
105
-
106
-
107
-
108
-
109
-
110
-
111
-
112
-
113
-
114
-
115
-
116
-
117
-
118
-
119
-
120
-
121
-
122
-
123
-
124
-
125
-
126
-
127
-
128
-
129
-
130
-
131
-
132
-
133
-
134
-
135
-
136
-
137
-
138
-
139
-
140
-
141
-
142
-
143
-
144
-
145
-
146
-
147
-
148
 |
 |

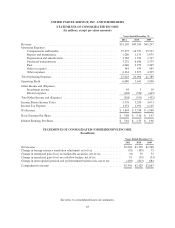
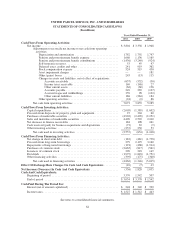
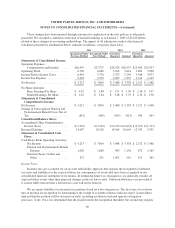
UNITED PARCEL SERVICE, INC. AND SUBSIDIARIES
STATEMENTS OF CONSOLIDATED CASH FLOWS
(In millions)
Years Ended December 31,
2011 2010 2009
Cash Flows From Operating Activities:
Net income ..................................................... $3,804 $ 3,338 $ 1,968
Adjustments to reconcile net income to net cash from operating
activities:
Depreciation and amortization .............................. 1,782 1,792 1,747
Pension and postretirement benefit expense ................... 1,660 1,136 1,165
Pension and postretirement benefit contributions ............... (1,436) (3,240) (924)
Self-insurance reserves .................................... 53 45 47
Deferred taxes, credits and other ............................ 241 919 362
Stock compensation expense ............................... 524 519 430
Asset impairment charges ................................. — — 181
Other (gains) losses ...................................... 245 (13) 115
Changes in assets and liabilities, net of effect of acquisitions:
Accounts receivable .................................. (657) (532) (30)
Income taxes receivable ............................... 169 (146) 27
Other current assets .................................. (62) (60) 136
Accounts payable .................................... 249 265 (107)
Accrued wages and withholdings ........................ 339 98 (102)
Other current liabilities ............................... 186 (284) 184
Other operating activities .................................. (24) (2) 86
Net cash from operating activities ............................... 7,073 3,835 5,285
Cash Flows From Investing Activities:
Capital expenditures .............................................. (2,005) (1,389) (1,602)
Proceeds from disposals of property, plant and equipment ................ 27 304 60
Purchases of marketable securities ................................... (4,903) (2,490) (2,251)
Sales and maturities of marketable securities .......................... 4,490 2,520 2,240
Net decrease in finance receivables .................................. 184 108 261
Cash received (paid) for business acquisitions and dispositions ............ (73) 63 (9)
Other investing activities .......................................... (257) 230 53
Net cash used in investing activities ............................. (2,537) (654) (1,248)
Cash Flows From Financing Activities:
Net change in short-term debt ...................................... (183) (481) (1,738)
Proceeds from long-term borrowings ................................. 279 2,195 3,160
Repayments of long-term borrowings ................................ (191) (468) (1,944)
Purchases of common stock ........................................ (2,665) (817) (561)
Issuances of common stock ........................................ 290 218 149
Dividends ...................................................... (1,997) (1,818) (1,751)
Other financing activities .......................................... (395) (175) (360)
Net cash used in financing activities ............................. (4,862) (1,346) (3,045)
Effect Of Exchange Rate Changes On Cash And Cash Equivalents .......... (10) (7) 43
Net Increase (Decrease) In Cash And Cash Equivalents ................... (336) 1,828 1,035
Cash And Cash Equivalents:
Beginning of period .............................................. 3,370 1,542 507
End of period ................................................... $3,034 $ 3,370 $ 1,542
Cash Paid During The Period For:
Interest (net of amount capitalized) .................................. $ 248 $ 340 $ 390
Income taxes .................................................... $1,527 $ 1,312 $ 443
See notes to consolidated financial statements.
64