UPS 2011 Annual Report Download - page 46
Download and view the complete annual report
Please find page 46 of the 2011 UPS annual report below. You can navigate through the pages in the report by either clicking on the pages listed below, or by using the keyword search tool below to find specific information within the annual report.-
 1
1 -
2
-
3
-
4
-
5
-
6
-
7
-
8
-
9
-
10
-
11
-
12
-
13
-
14
-
15
-
16
-
17
-
18
-
19
-
20
-
21
-
22
-
23
-
24
-
25
-
26
-
27
-
28
-
29
-
30
-
31
-
32
-
33
-
34
-
35
-
 36
36 -
 37
37 -
 38
38 -
 39
39 -
 40
40 -
 41
41 -
 42
42 -
 43
43 -
 44
44 -
 45
45 -
 46
46 -
 47
47 -
 48
48 -
 49
49 -
 50
50 -
 51
51 -
 52
52 -
 53
53 -
 54
54 -
 55
55 -
 56
56 -
57
-
58
-
59
-
60
-
61
-
62
-
63
-
64
-
65
-
66
-
67
-
68
-
69
-
70
-
71
-
72
-
73
-
74
-
75
-
76
-
77
-
78
-
79
-
80
-
81
-
82
-
83
-
84
-
85
-
86
-
87
-
88
-
89
-
90
-
91
-
92
-
93
-
94
-
95
-
96
-
97
-
98
-
99
-
100
-
101
-
102
-
103
-
104
-
105
-
106
-
107
-
108
-
109
-
110
-
111
-
112
-
113
-
114
-
115
-
116
-
117
-
118
-
119
-
120
-
121
-
122
-
123
-
124
-
125
-
126
-
127
-
128
-
129
-
130
-
131
-
132
-
133
-
134
-
135
-
136
-
137
-
138
-
139
-
140
-
141
-
142
-
143
-
144
-
145
-
146
-
147
-
148
 |
 |

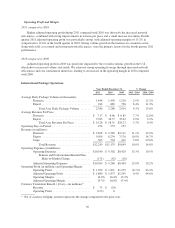
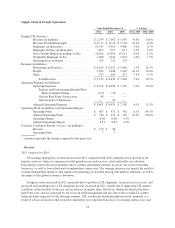
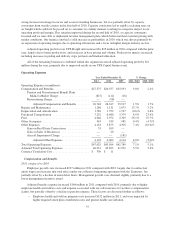
Supply Chain & Freight Operations
Year Ended December 31, % Change
2011 2010 2009 2011 / 2010 2010 / 2009
Freight LTL Statistics:
Revenue (in millions) ...................... $ 2,299 $ 2,002 $ 1,807 14.8% 10.8%
Revenue Per Hundredweight ................. $ 21.17 $ 19.18 $ 17.69 10.4% 8.4%
Shipments (in thousands) .................... 10,247 9,952 9,880 3.0% 0.7%
Shipments Per Day (in thousands) ............. 40.5 39.5 39.1 2.5% 1.0%
Gross Weight Hauled (in millions of lbs) ....... 10,858 10,440 10,211 4.0% 2.2%
Weight Per Shipment (in lbs) ................ 1,060 1,049 1,033 1.0% 1.5%
Operating Days in Period .................... 253 252 253
Revenue (in millions):
Forwarding and Logistics ................... $ 6,103 $ 6,022 $ 5,080 1.3% 18.5%
Freight .................................. 2,563 2,208 1,943 16.1% 13.6%
Other ................................... 473 440 417 7.5% 5.5%
Total Revenue ........................ $ 9,139 $ 8,670 $ 7,440 5.4% 16.5%
Operating Expenses (in millions):
Operating Expenses ........................ $ 8,532 $ 8,098 $ 7,130 5.4% 13.6%
Pension and Postretirement Benefit Plans
Mark-to-Market Charge ............... (177) (39) —
Gain on Real Estate Transactions ......... 48 — —
Gain on Sales of Businesses ............. — 20 —
Adjusted Operating Expenses ................ $ 8,403 $ 8,079 $ 7,130 4.0% 13.3%
Operating Profit (in millions) and Operating Margins:
Operating Profit ........................... $ 607 $ 572 $ 310 6.1% 84.5%
Adjusted Operating Profit ................... $ 736 $ 591 $ 310 24.5% 90.6%
Operating Margin .......................... 6.6% 6.6% 4.2%
Adjusted Operating Margin .................. 8.1% 6.8% 4.2%
Currency Translation Benefit / (Cost)—(in millions)*:
Revenue ................................. $ 139 $ 48
Operating Profit ........................... 7 7
* Amount represents the change compared to the prior year.
Revenue
2011 compared to 2010
Forwarding and logistics revenue increased in 2011 compared with 2010, primarily due to growth in our
logistics services, where we experienced solid growth in our mail services, retail and health care solutions.
Forwarding revenue decreased primarily due to volume and tonnage declines in our air and ocean forwarding
businesses, as well as lower third-party transportation carrier rates. The tonnage decrease was mainly the result of
revenue management initiatives that improve the matching of customer pricing with market conditions, as well as
the impact of the global economic slowdown.
Freight revenue increased in 2011, primarily due to growth in LTL shipments, an increase in base rates, and
increased fuel surcharge rates. LTL shipments per day increased in 2011, largely due to improving LTL market
conditions in the first half of the year and an increase in market share. However, volume declined in the latter
half of the year, and was impacted by our focus on yield management and also due to the overall LTL market
being adversely impacted by the slowing economy. LTL revenue per hundredweight increased, primarily as a
result of a base rate increase that took effect during the year, negotiated increases on existing contract rates and
34