UPS 2011 Annual Report Download - page 52
Download and view the complete annual report
Please find page 52 of the 2011 UPS annual report below. You can navigate through the pages in the report by either clicking on the pages listed below, or by using the keyword search tool below to find specific information within the annual report.-
 1
1 -
2
-
3
-
4
-
5
-
6
-
7
-
8
-
9
-
10
-
11
-
12
-
13
-
14
-
15
-
16
-
17
-
18
-
19
-
20
-
21
-
22
-
23
-
24
-
25
-
26
-
27
-
28
-
29
-
30
-
31
-
32
-
33
-
34
-
35
-
36
-
37
-
38
-
39
-
40
-
41
-
 42
42 -
 43
43 -
 44
44 -
 45
45 -
 46
46 -
 47
47 -
 48
48 -
 49
49 -
 50
50 -
 51
51 -
 52
52 -
 53
53 -
 54
54 -
 55
55 -
 56
56 -
 57
57 -
 58
58 -
 59
59 -
 60
60 -
 61
61 -
 62
62 -
63
-
64
-
65
-
66
-
67
-
68
-
69
-
70
-
71
-
72
-
73
-
74
-
75
-
76
-
77
-
78
-
79
-
80
-
81
-
82
-
83
-
84
-
85
-
86
-
87
-
88
-
89
-
90
-
91
-
92
-
93
-
94
-
95
-
96
-
97
-
98
-
99
-
100
-
101
-
102
-
103
-
104
-
105
-
106
-
107
-
108
-
109
-
110
-
111
-
112
-
113
-
114
-
115
-
116
-
117
-
118
-
119
-
120
-
121
-
122
-
123
-
124
-
125
-
126
-
127
-
128
-
129
-
130
-
131
-
132
-
133
-
134
-
135
-
136
-
137
-
138
-
139
-
140
-
141
-
142
-
143
-
144
-
145
-
146
-
147
-
148
 |
 |

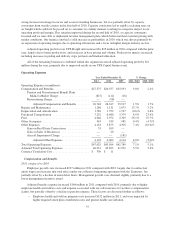
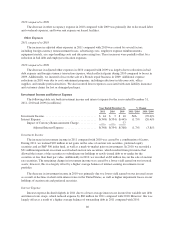
2010 compared to 2009
The decrease in other occupancy expense in 2010 compared with 2009 was primarily due to decreased labor
and overhead expenses, and lower rent expense on leased facilities.
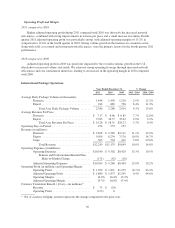
Other Expenses
2011 compared to 2010
The increase in adjusted other expenses in 2011 compared with 2010 was caused by several factors,
including foreign currency remeasurement losses, advertising costs, employee expense reimbursements,
equipment rentals, air cargo handling costs and data processing fees. These increases were partially offset by a
reduction in bad debt and employee relocation expenses.
2010 compared to 2009
The decrease in adjusted other expenses in 2010 compared with 2009 was largely due to reductions in bad
debt expense and foreign currency transaction expense, which reflected gains during 2010 compared to losses in
2009. Additionally, we incurred a loss on the sale of a French repair business in 2009. Additional expense
reductions in 2010 were due to cost containment programs, including reductions in telecom costs, office
supplies, and outside professional fees. We also incurred lower expenses associated with auto liability insurance
and customer claims for lost or damaged packages.
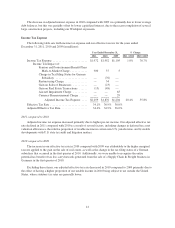
Investment Income and Interest Expense
The following table sets forth investment income and interest expense for the years ended December 31,
2011, 2010 and 2009 (in millions):
Year Ended December 31, % Change
2011 2010 2009 2011 / 2010 2010 / 2009
Investment Income .................................... $ 44 $ 3 $ 10 N/A (70.0)%
Interest Expense ...................................... $(348) $(354) $(445) (1.7)% (20.4)%
Impact of Currency Remeasurement Charge ............ — — 77
Adjusted Interest Expense ...................... $(348) $(354) $(368) (1.7)% (3.8)%
Investment Income
The increase in investment income in 2011 compared with 2010 was caused by a combination of factors.
During 2011, we realized $20 million in net gains on the sales of auction rate securities, preferred equity
securities and an S&P 500 index fund, as well as a mark-to-market gain on investments. In 2010, we recorded a
$21 million impairment on certain asset-backed auction rate securities, which resulted from provisions that
allowed the issuers of the securities to subordinate our holdings to newly-issued debt or to tender for the
securities at less than their par value. Additionally in 2010, we recorded an $8 million loss on the sale of auction
rate securities. The remaining change in investment income was caused by a lower yield earned on our invested
assets; however, this was largely offset by a higher average balance of interest-earning investments in our
portfolio.
The decrease in investment income in 2010 was primarily due to a lower yield earned on our invested assets
as a result of declines in short-term interest rates in the United States, as well as higher impairment losses on our
holdings of auction rate and preferred securities.
Interest Expense
Interest expense declined slightly in 2011 due to a lower average interest rate incurred on variable rate debt
and interest rate swaps, which reduced expense by $60 million for 2011 compared with 2010. However, this was
largely offset as a result of a higher average balance of outstanding debt in 2011 compared with 2010.
40