UPS 2011 Annual Report Download - page 43
Download and view the complete annual report
Please find page 43 of the 2011 UPS annual report below. You can navigate through the pages in the report by either clicking on the pages listed below, or by using the keyword search tool below to find specific information within the annual report.-
 1
1 -
2
-
3
-
4
-
5
-
6
-
7
-
8
-
9
-
10
-
11
-
12
-
13
-
14
-
15
-
16
-
17
-
18
-
19
-
20
-
21
-
22
-
23
-
24
-
25
-
26
-
27
-
28
-
29
-
30
-
31
-
32
-
 33
33 -
 34
34 -
 35
35 -
 36
36 -
 37
37 -
 38
38 -
 39
39 -
 40
40 -
 41
41 -
 42
42 -
 43
43 -
 44
44 -
 45
45 -
 46
46 -
 47
47 -
 48
48 -
 49
49 -
 50
50 -
 51
51 -
 52
52 -
 53
53 -
54
-
55
-
56
-
57
-
58
-
59
-
60
-
61
-
62
-
63
-
64
-
65
-
66
-
67
-
68
-
69
-
70
-
71
-
72
-
73
-
74
-
75
-
76
-
77
-
78
-
79
-
80
-
81
-
82
-
83
-
84
-
85
-
86
-
87
-
88
-
89
-
90
-
91
-
92
-
93
-
94
-
95
-
96
-
97
-
98
-
99
-
100
-
101
-
102
-
103
-
104
-
105
-
106
-
107
-
108
-
109
-
110
-
111
-
112
-
113
-
114
-
115
-
116
-
117
-
118
-
119
-
120
-
121
-
122
-
123
-
124
-
125
-
126
-
127
-
128
-
129
-
130
-
131
-
132
-
133
-
134
-
135
-
136
-
137
-
138
-
139
-
140
-
141
-
142
-
143
-
144
-
145
-
146
-
147
-
148
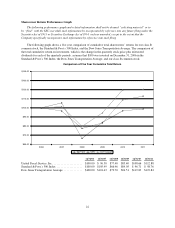
 |
 |

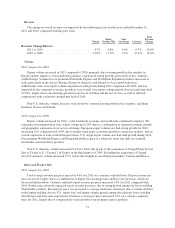
Revenue
The change in overall revenue was impacted by the following factors for the years ended December 31,
2011 and 2010, compared with the prior years:
Volume
Rates /
Product Mix
Fuel
Surcharge Currency
Total
Revenue
Change
Revenue Change Drivers:
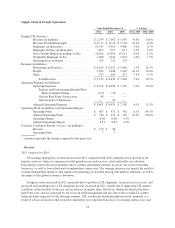
2011 vs 2010 ............................... 4.7% 0.6% 4.0% 0.7% 10.0%
2010 vs 2009 ............................... 13.6% (1.7)% 3.1% (0.2)% 14.8%
Volume
2011 compared to 2010
Export volume increased in 2011 compared to 2010, primarily due to strong growth in key markets in
Europe and the Americas. Our transborder products experienced strong growth, particularly in key countries
within Europe. Volume for our premium Worldwide Express and Worldwide Expedited products increased as
well, particularly in the Asia-to-Europe, Europe-to-Americas and Europe-to-Asia export trade lanes.
Additionally, intra-Asia export volume experienced solid growth during 2011 compared with 2010, and was
impacted by the continued economic growth in Asia overall. Our export volume growth slowed in the latter half
of 2011, largely due to decelerating growth in exports out of China and the rest of Asia, as well as difficult
comparisons with a relatively strong latter half of 2010.
Non-U.S. domestic volume increases were driven by continued strong growth in key markets, including
Germany, France and Poland.
2010 compared to 2009
Export volume increased for 2010, as the worldwide economy and world trade continued to improve. We
experienced strong growth in Asia, where volume grew 28% due to a combination of regional economic growth
and geographic expansion of our service offerings. European export volume also had strong growth for 2010,
increasing 10% compared with 2009, due to market share gains, economic growth in certain key markets, and an
overall expansion of trade in the European Union. U.S. origin export volume also had solid growth during 2010.
Our premium Worldwide Express and Expedited products grew at a relatively faster rate than our standard
transborder and trade direct products.
Non-U.S. domestic volume increased 15.2% for 2010, due in part to the acquisition of Unsped Paket Servisi
San ve Ticaret A.S. (“Unsped”) in Turkey in the third quarter of 2009. Excluding the acquisition of Unsped,
non-U.S. domestic volume increased 9.7%, led by the strength in core European markets, Canada and Mexico.
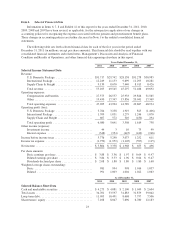
Rates and Product Mix
2011 compared to 2010
Total average revenue per piece increased 4.6% for 2011 on a currency-adjusted basis. Export revenue per
piece increased, largely due to a combination of higher fuel surcharge rates and base rate increases, which are
discussed further below. Currency-adjusted export revenue per piece increased 3.0% for 2011 compared with
2010. Product mix adversely impacted export revenue per piece, due to strong growth among our lower-yielding
Transborder products. Revenue per piece was pressured as average trade lanes shortened, due to volume declines
in the higher-yielding Asia-to-U.S. export lane, and higher volume growth among the relatively lower-yielding
intra-Europe and intra-Asia export lanes. Domestic revenue per piece increased 3.9% on a currency-adjusted
basis for 2011, largely due to comparatively faster growth in our premium express products.
31