UPS 2011 Annual Report Download - page 90
Download and view the complete annual report
Please find page 90 of the 2011 UPS annual report below. You can navigate through the pages in the report by either clicking on the pages listed below, or by using the keyword search tool below to find specific information within the annual report.-
 1
1 -
2
-
3
-
4
-
5
-
6
-
7
-
8
-
9
-
10
-
11
-
12
-
13
-
14
-
15
-
16
-
17
-
18
-
19
-
20
-
21
-
22
-
23
-
24
-
25
-
26
-
27
-
28
-
29
-
30
-
31
-
32
-
33
-
34
-
35
-
36
-
37
-
38
-
39
-
40
-
41
-
42
-
43
-
44
-
45
-
46
-
47
-
48
-
49
-
50
-
51
-
52
-
53
-
54
-
55
-
56
-
57
-
58
-
59
-
60
-
61
-
62
-
63
-
64
-
65
-
66
-
67
-
68
-
69
-
70
-
71
-
72
-
73
-
74
-
75
-
76
-
77
-
78
-
79
-
 80
80 -
 81
81 -
 82
82 -
 83
83 -
 84
84 -
 85
85 -
 86
86 -
 87
87 -
 88
88 -
 89
89 -
 90
90 -
 91
91 -
 92
92 -
 93
93 -
 94
94 -
 95
95 -
 96
96 -
 97
97 -
 98
98 -
 99
99 -
 100
100 -
101
-
102
-
103
-
104
-
105
-
106
-
107
-
108
-
109
-
110
-
111
-
112
-
113
-
114
-
115
-
116
-
117
-
118
-
119
-
120
-
121
-
122
-
123
-
124
-
125
-
126
-
127
-
128
-
129
-
130
-
131
-
132
-
133
-
134
-
135
-
136
-
137
-
138
-
139
-
140
-
141
-
142
-
143
-
144
-
145
-
146
-
147
-
148
 |
 |

UNITED PARCEL SERVICE, INC. AND SUBSIDIARIES
NOTES TO CONSOLIDATED FINANCIAL STATEMENTS—(Continued)
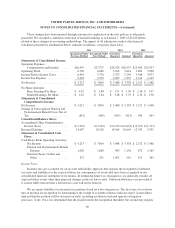
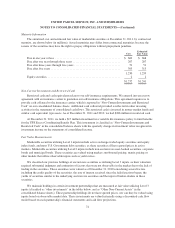
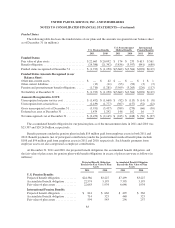
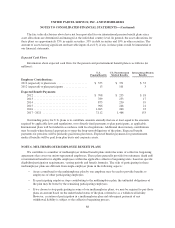
The following is an analysis of impaired finance receivables as of December 31, 2011 (in millions):
Recorded
Investment
Unpaid
Principal
Balance
Related
Allowance
Average
Recorded
Investment
Interest
Income
Recognized
Impaired loans with related allowance ............ $ 9 $ 36 $ 7 $14 $—
Impaired loans with no related allowance ......... 7 80 — 12 —
Impaired loans with U.S. government guarantee .... 35 35 — 51 —
Total impaired loans .......................... $51 $151 $ 7 $77 $—
The carrying value of finance receivables at December 31, 2011, by contractual maturity, is shown below
(in millions). Actual maturities may differ from contractual maturities because some borrowers have the right to
prepay these receivables without prepayment penalties.
Carrying
Value
Due in one year or less ....................................................... $130
Due after one year through three years ........................................... 33
Due after three years through five years .......................................... 28
Due after five years .......................................................... 160
$351
Based on interest rates for financial instruments with similar terms and maturities, the estimated fair value
of finance receivables is approximately $335 and $491 million as of December 31, 2011 and 2010, respectively.
At December 31, 2011, we had unfunded loan commitments totaling $248 million, consisting of standby letters
of credit of $29 million and other unfunded lending commitments of $219 million.
During 2009, impaired finance receivables with a carrying amount of $13 million were written down to a
net fair value of $8 million, based on the fair value for the related collateral which was determined using
unobservable inputs (Level 3).
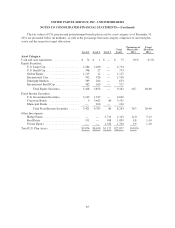
NOTE 4. PROPERTY, PLANT AND EQUIPMENT
Property, plant and equipment, including both owned assets as well as assets subject to capital leases,
consists of the following as of December 31 (in millions):
2011 2010
Vehicles ....................................................... $ 5,981 $ 5,519
Aircraft ........................................................ 14,616 14,063
Land .......................................................... 1,114 1,081
Buildings ....................................................... 3,095 3,102
Building and leasehold improvements ................................ 2,943 2,860
Plant equipment ................................................. 6,803 6,656
Technology equipment ............................................ 1,593 1,552
Equipment under operating leases ................................... 93 122
Construction-in-progress .......................................... 303 265
36,541 35,220
Less: Accumulated depreciation and amortization ....................... (18,920) (17,833)
$ 17,621 $ 17,387
78