UPS 2011 Annual Report Download - page 94
Download and view the complete annual report
Please find page 94 of the 2011 UPS annual report below. You can navigate through the pages in the report by either clicking on the pages listed below, or by using the keyword search tool below to find specific information within the annual report.-
 1
1 -
2
-
3
-
4
-
5
-
6
-
7
-
8
-
9
-
10
-
11
-
12
-
13
-
14
-
15
-
16
-
17
-
18
-
19
-
20
-
21
-
22
-
23
-
24
-
25
-
26
-
27
-
28
-
29
-
30
-
31
-
32
-
33
-
34
-
35
-
36
-
37
-
38
-
39
-
40
-
41
-
42
-
43
-
44
-
45
-
46
-
47
-
48
-
49
-
50
-
51
-
52
-
53
-
54
-
55
-
56
-
57
-
58
-
59
-
60
-
61
-
62
-
63
-
64
-
65
-
66
-
67
-
68
-
69
-
70
-
71
-
72
-
73
-
74
-
75
-
76
-
77
-
78
-
79
-
80
-
81
-
82
-
83
-
 84
84 -
 85
85 -
 86
86 -
 87
87 -
 88
88 -
 89
89 -
 90
90 -
 91
91 -
 92
92 -
 93
93 -
 94
94 -
 95
95 -
 96
96 -
 97
97 -
 98
98 -
 99
99 -
 100
100 -
 101
101 -
 102
102 -
 103
103 -
 104
104 -
105
-
106
-
107
-
108
-
109
-
110
-
111
-
112
-
113
-
114
-
115
-
116
-
117
-
118
-
119
-
120
-
121
-
122
-
123
-
124
-
125
-
126
-
127
-
128
-
129
-
130
-
131
-
132
-
133
-
134
-
135
-
136
-
137
-
138
-
139
-
140
-
141
-
142
-
143
-
144
-
145
-
146
-
147
-
148
 |
 |

UNITED PARCEL SERVICE, INC. AND SUBSIDIARIES
NOTES TO CONSOLIDATED FINANCIAL STATEMENTS—(Continued)
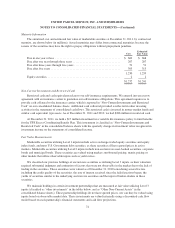
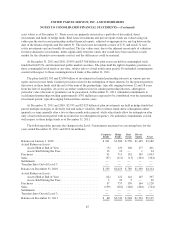
Assumed health care cost trends can have a significant effect on the amounts reported for the U.S.
postretirement medical plans. A one-percent change in assumed health care cost trend rates would have had the
following effects on 2011 results (in millions):
1% Increase 1% Decrease
Effect on total of service cost and interest cost ...................... $ 6 $ (6)
Effect on postretirement benefit obligation ......................... $61 $(65)
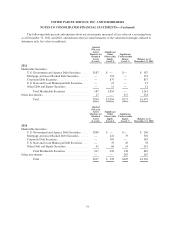
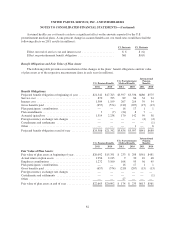
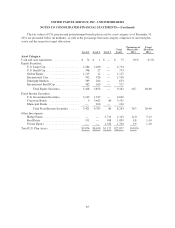
Benefit Obligations and Fair Value of Plan Assets
The following table provides a reconciliation of the changes in the plans’ benefit obligations and fair value
of plan assets as of the respective measurement dates in each year (in millions).
U.S. Pension Benefits
U.S. Postretirement
Medical Benefits
International
Pension
Benefits
2011 2010 2011 2010 2011 2010
Benefit Obligations:
Projected benefit obligation at beginning of year ........ $21,342 $17,763 $3,597 $3,336 $680 $575
Service cost ..................................... 870 723 89 86 34 24
Interest cost ..................................... 1,309 1,199 207 214 39 34
Gross benefits paid ............................... (657) (574) (219) (207) (15) (13)
Plan participants’ contributions ...................... — — 16 17 1 1
Plan amendments ................................. 3 (7) (24) 8 7 —
Actuarial (gain)/loss .............................. 1,519 2,238 170 142 99 58
Foreign currency exchange rate changes .............. — — — — (4) (4)
Curtailments and settlements ....................... — — — — — (1)
Other .......................................... — — — 1 — 6
Projected benefit obligation at end of year ............. $24,386 $21,342 $3,836 $3,597 $841 $680
U.S. Pension Benefits
U.S. Postretirement
Medical Benefits
International
Pension
Benefits
2011 2010 2011 2010 2011 2010
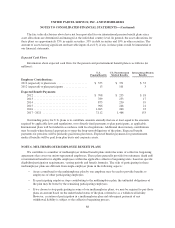
Fair Value of Plan Assets:
Fair value of plan assets at beginning of year ........... $20,092 $15,351 $ 233 $ 298 $561 $481
Actual return on plan assets ........................ 1,956 2,215 9 30 10 48
Employer contributions ............................ 1,272 3,100 108 95 56 45
Plan participants’ contributions ...................... — — 16 17 1 1
Gross benefits paid ............................... (657) (574) (219) (207) (15) (13)
Foreign currency exchange rate changes .............. — — — — — —
Curtailments and settlements ....................... — — — — — (1)
Other .......................................... — — 27 — — —
Fair value of plan assets at end of year ................ $22,663 $20,092 $ 174 $ 233 $613 $561
82