UPS 2011 Annual Report Download - page 53
Download and view the complete annual report
Please find page 53 of the 2011 UPS annual report below. You can navigate through the pages in the report by either clicking on the pages listed below, or by using the keyword search tool below to find specific information within the annual report.-
 1
1 -
2
-
3
-
4
-
5
-
6
-
7
-
8
-
9
-
10
-
11
-
12
-
13
-
14
-
15
-
16
-
17
-
18
-
19
-
20
-
21
-
22
-
23
-
24
-
25
-
26
-
27
-
28
-
29
-
30
-
31
-
32
-
33
-
34
-
35
-
36
-
37
-
38
-
39
-
40
-
41
-
42
-
 43
43 -
 44
44 -
 45
45 -
 46
46 -
 47
47 -
 48
48 -
 49
49 -
 50
50 -
 51
51 -
 52
52 -
 53
53 -
 54
54 -
 55
55 -
 56
56 -
 57
57 -
 58
58 -
 59
59 -
 60
60 -
 61
61 -
 62
62 -
 63
63 -
64
-
65
-
66
-
67
-
68
-
69
-
70
-
71
-
72
-
73
-
74
-
75
-
76
-
77
-
78
-
79
-
80
-
81
-
82
-
83
-
84
-
85
-
86
-
87
-
88
-
89
-
90
-
91
-
92
-
93
-
94
-
95
-
96
-
97
-
98
-
99
-
100
-
101
-
102
-
103
-
104
-
105
-
106
-
107
-
108
-
109
-
110
-
111
-
112
-
113
-
114
-
115
-
116
-
117
-
118
-
119
-
120
-
121
-
122
-
123
-
124
-
125
-
126
-
127
-
128
-
129
-
130
-
131
-
132
-
133
-
134
-
135
-
136
-
137
-
138
-
139
-
140
-
141
-
142
-
143
-
144
-
145
-
146
-
147
-
148
 |
 |

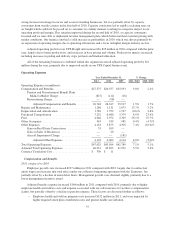
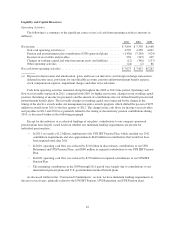
The decrease in adjusted interest expense in 2010 compared with 2009 was primarily due to lower average
debt balances, but this was partially offset by lower capitalized interest, due to the recent completion of several
large construction projects, including our Worldport expansion.
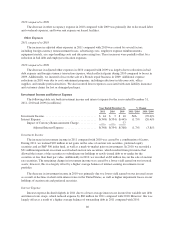
Income Tax Expense
The following table sets forth income tax expense and our effective tax rate for the years ended
December 31, 2011, 2010 and 2009 (in millions):
Year Ended December 31, % Change
2011 2010 2009 2011 / 2010 2010 / 2009
Income Tax Expense ........................ $1,972 $1,952 $1,105 1.0% 76.7%
Income Tax Impact of:
Pension and Postretirement Benefit Plans
Mark-to-Market Charge ............ 300 37 5
Change in Tax Filing Status for German
Subsidiary ...................... — (76) —
Restructuring Charge ................ — 34 —
Gain on Sales of Businesses .......... — (23) —
Gain on Real Estate Transactions ...... (13) (48) —
Aircraft Impairment Charge .......... — — 65
Currency Remeasurement Charge ...... — — 29
Adjusted Income Tax Expense .... $2,259 $1,876 $1,204 20.4% 55.8%
Effective Tax Rate .......................... 34.1% 36.9% 36.0%
Adjusted Effective Tax Rate .................. 34.4% 34.9% 36.0%
2011 compared to 2010
Adjusted income tax expense increased primarily due to higher pre-tax income. Our adjusted effective tax
rate declined in 2011 compared with 2010 as a result of several factors, including changes in deferred tax asset
valuation allowances, the relative proportion of taxable income in certain non-U.S. jurisdictions, and favorable
developments with U.S. state tax audit and litigation matters.
2010 compared to 2009
The increase in our effective tax rate in 2010 compared with 2009 was attributable to the higher marginal
tax rate applied to the gain on the sale of real estate, as well as the change in the tax filing status of a German
subsidiary that occurred in the first quarter of 2010. Additionally, we were unable to recognize the entire
potential tax benefit of tax loss carryforwards generated from the sale of a Supply Chain & Freight business in
Germany in the first quarter of 2010.
Excluding these items, our adjusted effective tax rate decreased in 2010 compared to 2009 primarily due to
the effect of having a higher proportion of our taxable income in 2010 being subject to tax outside the United
States, where statutory tax rates are generally lower.
41