UPS 2011 Annual Report Download - page 119
Download and view the complete annual report
Please find page 119 of the 2011 UPS annual report below. You can navigate through the pages in the report by either clicking on the pages listed below, or by using the keyword search tool below to find specific information within the annual report.-
 1
1 -
2
-
3
-
4
-
5
-
6
-
7
-
8
-
9
-
10
-
11
-
12
-
13
-
14
-
15
-
16
-
17
-
18
-
19
-
20
-
21
-
22
-
23
-
24
-
25
-
26
-
27
-
28
-
29
-
30
-
31
-
32
-
33
-
34
-
35
-
36
-
37
-
38
-
39
-
40
-
41
-
42
-
43
-
44
-
45
-
46
-
47
-
48
-
49
-
50
-
51
-
52
-
53
-
54
-
55
-
56
-
57
-
58
-
59
-
60
-
61
-
62
-
63
-
64
-
65
-
66
-
67
-
68
-
69
-
70
-
71
-
72
-
73
-
74
-
75
-
76
-
77
-
78
-
79
-
80
-
81
-
82
-
83
-
84
-
85
-
86
-
87
-
88
-
89
-
90
-
91
-
92
-
93
-
94
-
95
-
96
-
97
-
98
-
99
-
100
-
101
-
102
-
103
-
104
-
105
-
106
-
107
-
108
-
 109
109 -
 110
110 -
 111
111 -
 112
112 -
 113
113 -
 114
114 -
 115
115 -
 116
116 -
 117
117 -
 118
118 -
 119
119 -
 120
120 -
 121
121 -
 122
122 -
 123
123 -
 124
124 -
 125
125 -
 126
126 -
 127
127 -
 128
128 -
 129
129 -
130
-
131
-
132
-
133
-
134
-
135
-
136
-
137
-
138
-
139
-
140
-
141
-
142
-
143
-
144
-
145
-
146
-
147
-
148
 |
 |

UNITED PARCEL SERVICE, INC. AND SUBSIDIARIES
NOTES TO CONSOLIDATED FINANCIAL STATEMENTS—(Continued)
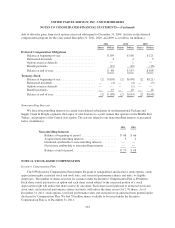
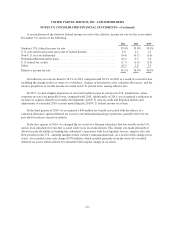
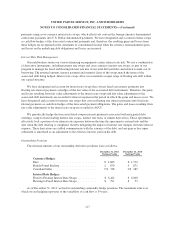
The fair value of each option grant is estimated using the Black-Scholes option pricing model. The weighted
average assumptions used, by year, and the calculated weighted average fair values of options, are as follows:
2011 2010 2009
Expected dividend yield ................................................. 2.77% 2.70% 3.25%
Risk-free interest rate ................................................... 2.90% 3.30% 3.22%
Expected life in years ................................................... 7.5 7.5 7.5
Expected volatility ..................................................... 24.26% 23.59% 23.16%
Weighted average fair value of options granted .............................. $15.92 $14.83 $10.86
Expected volatilities are based on the historical returns on our stock and the implied volatility of our
publicly-traded options. The expected dividend yield is based on the recent historical dividend yields for our
stock, taking into account changes in dividend policy. The risk-free interest rate is based on the term structure of
interest rates at the time of the option grant. The expected life represents an estimate of the period of time options
are expected to remain outstanding, and we have relied upon a combination of the observed exercise behavior of
our prior grants with similar characteristics, the vesting schedule of the grants, and an index of peer companies
with similar grant characteristics in estimating this variable.
We received cash of $92, $60 and $27 million during 2011, 2010, and 2009, respectively, from option
holders resulting from the exercise of stock options. We received a tax benefit of $6, $4 and $1 million during
2011, 2010, and 2009, respectively, from the exercise of stock options, which is reported as cash from financing
activities in the cash flow statement.
The total intrinsic value of options exercised during 2011, 2010, and 2009 was $31, $18 and $5 million,
respectively. As of December 31, 2011, there was $4 million of total unrecognized compensation cost related to
nonvested options. That cost is expected to be recognized over a weighted average period of 1 year and
11 months.
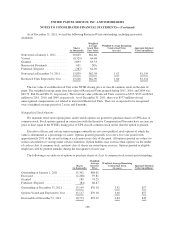
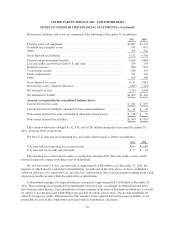
The following table summarizes information about stock options outstanding and exercisable at
December 31, 2011:
Options Outstanding Options Exercisable
Exercise Price Range
Shares
(in thousands)
Average Life
(in years)
Average
Exercise
Price
Shares
(in thousands)
Average
Exercise
Price
$50.01 - $60.00 ........................... 244 7.35 $55.83 109 $55.83
$60.01 - $70.00 ........................... 3,377 1.31 61.78 3,246 61.57
$70.01 - $80.00 ........................... 7,378 3.98 71.30 5,218 71.34
$80.01 - $90.00 ........................... 2,200 4.33 80.92 2,200 80.92
13,199 3.42 $70.18 10,773 $70.19
Discounted Employee Stock Purchase Plan
We maintain an employee stock purchase plan for all eligible employees, which was modified in 2009.
Under the modified plan, shares of UPS class A common stock may be purchased at quarterly intervals at 95% of
the NYSE closing price of UPS class B common stock on the last day of each quarterly period. Prior to the
modification in the second quarter of 2009, shares could be purchased at quarterly intervals at 90% of the lower
of the NYSE closing price of the UPS class B common stock on the first or the last day of each quarterly period.
107