UPS 2011 Annual Report Download - page 47
Download and view the complete annual report
Please find page 47 of the 2011 UPS annual report below. You can navigate through the pages in the report by either clicking on the pages listed below, or by using the keyword search tool below to find specific information within the annual report.-
 1
1 -
2
-
3
-
4
-
5
-
6
-
7
-
8
-
9
-
10
-
11
-
12
-
13
-
14
-
15
-
16
-
17
-
18
-
19
-
20
-
21
-
22
-
23
-
24
-
25
-
26
-
27
-
28
-
29
-
30
-
31
-
32
-
33
-
34
-
35
-
36
-
 37
37 -
 38
38 -
 39
39 -
 40
40 -
 41
41 -
 42
42 -
 43
43 -
 44
44 -
 45
45 -
 46
46 -
 47
47 -
 48
48 -
 49
49 -
 50
50 -
 51
51 -
 52
52 -
 53
53 -
 54
54 -
 55
55 -
 56
56 -
 57
57 -
58
-
59
-
60
-
61
-
62
-
63
-
64
-
65
-
66
-
67
-
68
-
69
-
70
-
71
-
72
-
73
-
74
-
75
-
76
-
77
-
78
-
79
-
80
-
81
-
82
-
83
-
84
-
85
-
86
-
87
-
88
-
89
-
90
-
91
-
92
-
93
-
94
-
95
-
96
-
97
-
98
-
99
-
100
-
101
-
102
-
103
-
104
-
105
-
106
-
107
-
108
-
109
-
110
-
111
-
112
-
113
-
114
-
115
-
116
-
117
-
118
-
119
-
120
-
121
-
122
-
123
-
124
-
125
-
126
-
127
-
128
-
129
-
130
-
131
-
132
-
133
-
134
-
135
-
136
-
137
-
138
-
139
-
140
-
141
-
142
-
143
-
144
-
145
-
146
-
147
-
148
 |
 |
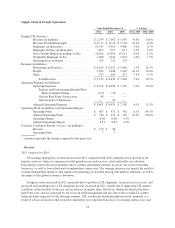
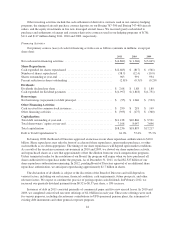
higher fuel surcharge rates, as total fuel surcharge revenue increased $159 million for the year driven by higher
diesel fuel prices. An increase in base prices took effect on August 1, 2011, as our freight unit increased
minimum charge, LTL and TL rates an average of 6.9%, covering non-contractual shipments in the United
States, Canada and Mexico.
The other businesses within Supply Chain & Freight experienced an increase in revenue, primarily due to
growth at UPS Capital, the UPS Store, UPS Customer Solutions and our contract to provide domestic air
transportation services for the U.S. Postal Service.
2010 compared to 2009
Forwarding and logistics revenue increased in 2010, primarily due to growth in the demand for forwarding
as a result of the continued expansion of the worldwide economy, inventory rebuilding and world trade. In our
forwarding business, both air freight and ocean freight experienced solid revenue growth, due primarily to higher
volumes, fuel surcharges, and other accessorial charges. International air freight tonnage increased 19% for 2010
compared with the prior year. In our logistics products, we experienced growth in mail services and distribution
revenue, with solid increases being achieved in the health care and technology sectors.
Freight revenue increased, primarily due to higher fuel surcharge rates and a base rate increase that took
effect in January 2010. Average LTL shipments per day, weight per shipment and LTL revenue per
hundredweight all increased during the year, largely due to our strategy of maintaining our focus on yields and
targeting certain customer segments. The increase in LTL revenue per hundredweight was primarily due to an
increase in base prices that took effect in January 2010, as UPS Freight increased minimum charge, LTL and TL
rates an average of 5.7%, covering non-contractual shipments in the United States, Canada, and Mexico. An
additional 5.9% rate increase took effect October 18, 2010. Additionally, LTL revenue per hundredweight
increased as a result of higher fuel surcharge rates, as total fuel surcharge revenue increased $105 million for the
year primarily resulting from higher diesel fuel prices.
The other businesses within Supply Chain & Freight experienced an increase in revenue. A primary driver
of this increase was our UPS Customer Solutions business, which provides a range of services (e.g. project
management, industrial engineering, transportation fleet services, distribution network analysis, package
engineering, and package visibility).
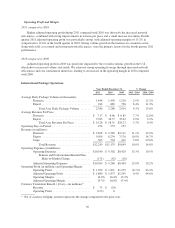
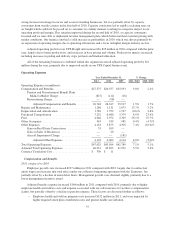
Operating Expenses
2011 compared to 2010
Forwarding and logistics adjusted operating expenses were flat in 2011 compared with 2010. Purchased
transportation expense declined by $87 million in 2011, due to lower air freight volume as well as lower rates
passed to us from third-party transportation carriers. The reduction in third-party carrier rates was largely due to
over-capacity in the Asia-to-U.S. trade lane that began in the latter half of 2010 and continued into the first half
of 2011. This reduction in purchased transportation costs was offset by increases in several other expense
categories, including other occupancy costs, depreciation and amortization, repairs and maintenance, and other
expenses.
Freight operating expenses increased $317 million for 2011 on an adjusted basis, with the total cost per LTL
shipment increasing 10.0% for the year. The two largest components of this increase relate to the cost of
operating our linehaul network, which increased $134 million in 2011, and pick-up, delivery and dock costs,
which increased $112 million for the year. We incurred higher fuel costs operating our vehicle fleet, as well as
higher fuel surcharge rates passed to us from outside transportation carriers, as a result of higher diesel fuel
prices and increased volume. Additionally, compensation and benefit costs increased primarily as a result of
higher pension and health care costs, and effective wage increases of 4.1% for drivers in our linehaul network
35