UPS 2011 Annual Report Download - page 120
Download and view the complete annual report
Please find page 120 of the 2011 UPS annual report below. You can navigate through the pages in the report by either clicking on the pages listed below, or by using the keyword search tool below to find specific information within the annual report.-
 1
1 -
2
-
3
-
4
-
5
-
6
-
7
-
8
-
9
-
10
-
11
-
12
-
13
-
14
-
15
-
16
-
17
-
18
-
19
-
20
-
21
-
22
-
23
-
24
-
25
-
26
-
27
-
28
-
29
-
30
-
31
-
32
-
33
-
34
-
35
-
36
-
37
-
38
-
39
-
40
-
41
-
42
-
43
-
44
-
45
-
46
-
47
-
48
-
49
-
50
-
51
-
52
-
53
-
54
-
55
-
56
-
57
-
58
-
59
-
60
-
61
-
62
-
63
-
64
-
65
-
66
-
67
-
68
-
69
-
70
-
71
-
72
-
73
-
74
-
75
-
76
-
77
-
78
-
79
-
80
-
81
-
82
-
83
-
84
-
85
-
86
-
87
-
88
-
89
-
90
-
91
-
92
-
93
-
94
-
95
-
96
-
97
-
98
-
99
-
100
-
101
-
102
-
103
-
104
-
105
-
106
-
107
-
108
-
109
-
 110
110 -
 111
111 -
 112
112 -
 113
113 -
 114
114 -
 115
115 -
 116
116 -
 117
117 -
 118
118 -
 119
119 -
 120
120 -
 121
121 -
 122
122 -
 123
123 -
 124
124 -
 125
125 -
 126
126 -
 127
127 -
 128
128 -
 129
129 -
 130
130 -
131
-
132
-
133
-
134
-
135
-
136
-
137
-
138
-
139
-
140
-
141
-
142
-
143
-
144
-
145
-
146
-
147
-
148
 |
 |
UNITED PARCEL SERVICE, INC. AND SUBSIDIARIES
NOTES TO CONSOLIDATED FINANCIAL STATEMENTS—(Continued)
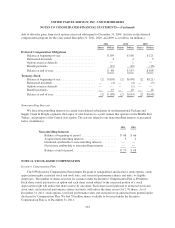
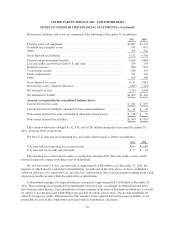
Employees purchased 1.3, 1.5 and 0.6 million shares at average prices of $66.86, $57.98 and $44.30 per share
during 2011, 2010, and 2009, respectively. Subsequent to the modification, the plan is no longer considered to be
compensatory, and therefore no compensation cost is measured for the modified employees’ purchase rights.
Prior to the modification, compensation cost was measured for the fair value of employees’ purchase rights under
our discounted employee stock purchase plan using the Black-Scholes option pricing model, and we determined
the weighted average fair value of the employee purchase rights to be $7.52 per share for 2009.
NOTE 12. SEGMENT AND GEOGRAPHIC INFORMATION
We report our operations in three segments: U.S. Domestic Package operations, International Package
operations and Supply Chain & Freight operations. Package operations represent our most significant business
and are broken down into regional operations around the world. Regional operations managers are responsible
for both domestic and export operations within their geographic area.
U.S. Domestic Package
Domestic Package operations include the time-definite delivery of letters, documents and packages
throughout the United States.
International Package
International Package operations include delivery to more than 220 countries and territories worldwide,
including shipments wholly outside the United States, as well as shipments with either origin or destination
outside the United States. Our International Package reporting segment includes the operations of our Europe,
Asia and Americas operating segments.
Supply Chain & Freight
Supply Chain & Freight includes our forwarding and logistics operations, UPS Freight and other aggregated
business units. Our forwarding and logistics business provides services in more than 195 countries and territories
worldwide, and includes supply chain design and management, freight distribution, customs brokerage, mail and
consulting services. UPS Freight offers a variety of LTL and TL services to customers in North America. Other
aggregated business units within this segment include Mail Boxes Etc. (the franchisor of Mail Boxes Etc. and
The UPS Store) and UPS Capital.
In evaluating financial performance, we focus on operating profit as a segment’s measure of profit or loss.
Operating profit is before investment income, interest expense and income taxes. The accounting policies of the
reportable segments are the same as those described in the summary of accounting policies (see Note 1), with
certain expenses allocated between the segments using activity-based costing methods. Unallocated assets are
comprised primarily of cash, marketable securities, and certain investment partnerships.
108