UPS 2011 Annual Report Download - page 40
Download and view the complete annual report
Please find page 40 of the 2011 UPS annual report below. You can navigate through the pages in the report by either clicking on the pages listed below, or by using the keyword search tool below to find specific information within the annual report.-
 1
1 -
2
-
3
-
4
-
5
-
6
-
7
-
8
-
9
-
10
-
11
-
12
-
13
-
14
-
15
-
16
-
17
-
18
-
19
-
20
-
21
-
22
-
23
-
24
-
25
-
26
-
27
-
28
-
29
-
 30
30 -
 31
31 -
 32
32 -
 33
33 -
 34
34 -
 35
35 -
 36
36 -
 37
37 -
 38
38 -
 39
39 -
 40
40 -
 41
41 -
 42
42 -
 43
43 -
 44
44 -
 45
45 -
 46
46 -
 47
47 -
 48
48 -
 49
49 -
 50
50 -
51
-
52
-
53
-
54
-
55
-
56
-
57
-
58
-
59
-
60
-
61
-
62
-
63
-
64
-
65
-
66
-
67
-
68
-
69
-
70
-
71
-
72
-
73
-
74
-
75
-
76
-
77
-
78
-
79
-
80
-
81
-
82
-
83
-
84
-
85
-
86
-
87
-
88
-
89
-
90
-
91
-
92
-
93
-
94
-
95
-
96
-
97
-
98
-
99
-
100
-
101
-
102
-
103
-
104
-
105
-
106
-
107
-
108
-
109
-
110
-
111
-
112
-
113
-
114
-
115
-
116
-
117
-
118
-
119
-
120
-
121
-
122
-
123
-
124
-
125
-
126
-
127
-
128
-
129
-
130
-
131
-
132
-
133
-
134
-
135
-
136
-
137
-
138
-
139
-
140
-
141
-
142
-
143
-
144
-
145
-
146
-
147
-
148
 |
 |
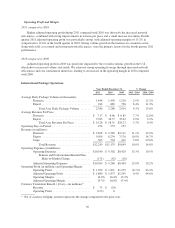
represent approximately 40% of total U.S. Domestic Package volume, experienced stronger growth than
commercial volume. Volume growth accelerated in the fourth quarter, with average daily volume increasing
3.8% over the fourth quarter of 2010.
Among our air products, we experienced a 4.8% increase in Next Day and Second Day air package volume,
as a result of retail sales growth, with particular growth in our Next Day Air Saver product. Air letter volume
declined, largely due to weakness in the financial and other service industries. Within ground, our light weight
products, which target low-cost, non-urgent ground residential deliveries, experienced solid growth during 2011.
During the fourth quarter of 2011, volume growth accelerated to 12.3% and 3.5% in our deferred and ground
products, respectively, compared with the fourth quarter of 2010. These increases were primarily driven by
higher business-to-consumer shipment growth during the holiday season.
2010 compared to 2009
In 2010, our overall volume increased as improvements in industrial production and retail sales increased
overall demand in the U.S. small package market. Among our air products, Next Day and Second Day air
package volume increased 2.1% as inventory rebuilding in the manufacturing and retailing sectors contributed to
growth. However, our letter volume declined largely due to weakness in the financial and other service
industries. The growth in ground volume was driven by increased volume from the manufacturing and retailing
sectors.
Rates and Product Mix
2011 compared to 2010
Overall revenue per piece increased for our ground and air products during 2011 due to a combination of
base price increases and fuel surcharge rate changes, which are discussed further below. The overall revenue per
piece increase was also positively affected by our focus on revenue management initiatives. In addition, the
revenue per piece increase for our air products was positively impacted by the overall mix shift from letters to
packages. Comparing the fourth quarter of 2011 with 2010, the average revenue per piece increase slowed to
3.4% due to the higher volume of lighter-weight business-to-consumer packages.
Revenue per piece for our ground and air products was also impacted by an increase in base rates that took
effect on January 3, 2011. We increased the base rates 6.9% on UPS Next Day Air, UPS 2nd Day Air, and UPS 3
Day Select, and 5.9% on UPS Ground, while reducing our fuel surcharge indexes (discussed further below).
Other pricing changes included an increase in the residential surcharge, and an increase in the delivery area
surcharge on both residential and commercial services to certain ZIP codes.
2010 compared to 2009
Overall revenue per piece increased for our ground and air products in 2010, largely due to a combination of
base price increases and fuel surcharge rate changes, which are discussed further below. The revenue per piece
for our air products also improved as a result of higher average package weights and the overall mix shift from
letters to packages. For both our air and ground products, revenue per piece was negatively affected by a shift in
product mix to our less premium services, such as Next Day Air Saver and Ground Basic.
Revenue per piece for our ground and air products was impacted by an increase in base rates that took effect
on January 4, 2010. We increased the base rates 6.9% on UPS Next Day Air, UPS 2nd Day Air, and UPS 3 Day
Select, and 4.9% on UPS Ground. Other pricing changes included an increase in the residential surcharge, and an
increase in the delivery area surcharge on both residential and commercial services to certain ZIP codes.
28