UPS 2011 Annual Report Download - page 34
Download and view the complete annual report
Please find page 34 of the 2011 UPS annual report below. You can navigate through the pages in the report by either clicking on the pages listed below, or by using the keyword search tool below to find specific information within the annual report.-
 1
1 -
2
-
3
-
4
-
5
-
6
-
7
-
8
-
9
-
10
-
11
-
12
-
13
-
14
-
15
-
16
-
17
-
18
-
19
-
20
-
21
-
22
-
23
-
 24
24 -
 25
25 -
 26
26 -
 27
27 -
 28
28 -
 29
29 -
 30
30 -
 31
31 -
 32
32 -
 33
33 -
 34
34 -
 35
35 -
 36
36 -
 37
37 -
 38
38 -
 39
39 -
 40
40 -
 41
41 -
 42
42 -
 43
43 -
 44
44 -
45
-
46
-
47
-
48
-
49
-
50
-
51
-
52
-
53
-
54
-
55
-
56
-
57
-
58
-
59
-
60
-
61
-
62
-
63
-
64
-
65
-
66
-
67
-
68
-
69
-
70
-
71
-
72
-
73
-
74
-
75
-
76
-
77
-
78
-
79
-
80
-
81
-
82
-
83
-
84
-
85
-
86
-
87
-
88
-
89
-
90
-
91
-
92
-
93
-
94
-
95
-
96
-
97
-
98
-
99
-
100
-
101
-
102
-
103
-
104
-
105
-
106
-
107
-
108
-
109
-
110
-
111
-
112
-
113
-
114
-
115
-
116
-
117
-
118
-
119
-
120
-
121
-
122
-
123
-
124
-
125
-
126
-
127
-
128
-
129
-
130
-
131
-
132
-
133
-
134
-
135
-
136
-
137
-
138
-
139
-
140
-
141
-
142
-
143
-
144
-
145
-
146
-
147
-
148
 |
 |

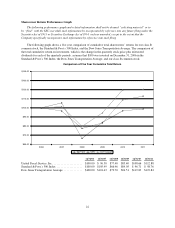
Shareowner Return Performance Graph
The following performance graph and related information shall not be deemed “soliciting material” or to
be “filed” with the SEC, nor shall such information be incorporated by reference into any future filing under the
Securities Act of 1933 or Securities Exchange Act of 1934, each as amended, except to the extent that the
Company specifically incorporates such information by reference into such filing.
The following graph shows a five year comparison of cumulative total shareowners’ returns for our class B
common stock, the Standard & Poor’s 500 Index, and the Dow Jones Transportation Average. The comparison of
the total cumulative return on investment, which is the change in the quarterly stock price plus reinvested
dividends for each of the quarterly periods, assumes that $100 was invested on December 31, 2006 in the
Standard & Poor’s 500 Index, the Dow Jones Transportation Average, and our class B common stock.
Comparison of Five Year Cumulative Total Return
$60.00
$70.00
$80.00
$90.00
$100.00
$110.00
$120.00
$140.00
$130.00
201120102009200820072006
S&P 500 UPS DJ Transport
12/31/06 12/31/07 12/31/08 12/31/09 12/31/10 12/31/11
United Parcel Service, Inc. .................... $100.00 $ 96.50 $77.40 $83.40 $108.66 $112.88
Standard & Poor’s 500 Index .................. $100.00 $105.49 $66.46 $84.05 $ 96.71 $ 98.76
Dow Jones Transportation Average ............. $100.00 $101.43 $79.70 $94.51 $119.83 $119.84
22