UPS 2011 Annual Report Download - page 45
Download and view the complete annual report
Please find page 45 of the 2011 UPS annual report below. You can navigate through the pages in the report by either clicking on the pages listed below, or by using the keyword search tool below to find specific information within the annual report.-
 1
1 -
2
-
3
-
4
-
5
-
6
-
7
-
8
-
9
-
10
-
11
-
12
-
13
-
14
-
15
-
16
-
17
-
18
-
19
-
20
-
21
-
22
-
23
-
24
-
25
-
26
-
27
-
28
-
29
-
30
-
31
-
32
-
33
-
34
-
 35
35 -
 36
36 -
 37
37 -
 38
38 -
 39
39 -
 40
40 -
 41
41 -
 42
42 -
 43
43 -
 44
44 -
 45
45 -
 46
46 -
 47
47 -
 48
48 -
 49
49 -
 50
50 -
 51
51 -
 52
52 -
 53
53 -
 54
54 -
 55
55 -
56
-
57
-
58
-
59
-
60
-
61
-
62
-
63
-
64
-
65
-
66
-
67
-
68
-
69
-
70
-
71
-
72
-
73
-
74
-
75
-
76
-
77
-
78
-
79
-
80
-
81
-
82
-
83
-
84
-
85
-
86
-
87
-
88
-
89
-
90
-
91
-
92
-
93
-
94
-
95
-
96
-
97
-
98
-
99
-
100
-
101
-
102
-
103
-
104
-
105
-
106
-
107
-
108
-
109
-
110
-
111
-
112
-
113
-
114
-
115
-
116
-
117
-
118
-
119
-
120
-
121
-
122
-
123
-
124
-
125
-
126
-
127
-
128
-
129
-
130
-
131
-
132
-
133
-
134
-
135
-
136
-
137
-
138
-
139
-
140
-
141
-
142
-
143
-
144
-
145
-
146
-
147
-
148
 |
 |
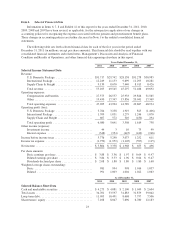
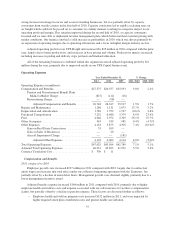
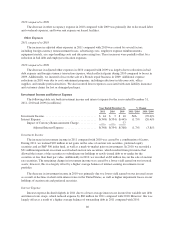
package sort expenses. Network costs increased $498 million for the year due largely to higher fuel costs and
increased block hours. Pick-up and delivery costs increased $270 million for the year, primarily as a result of
higher fuel prices and increased package volume. Package sorting expenses increased $61 million, and were
impacted by higher labor costs and increased depreciation on certain operating facilities.
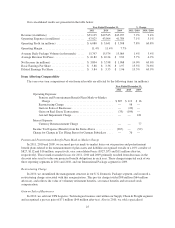
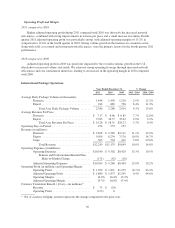
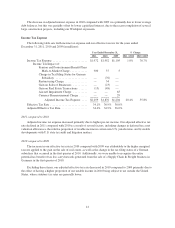
Operating Profit and Margin
2011 compared to 2010
Adjusted operating profit increased slightly in 2011 compared with 2010, while the segment operating
margin declined for the year due to several factors. The overall increase in adjusted operating profit was largely
due to the volume and revenue per piece increases previously discussed; however, the impact of these items was
largely offset by excess capacity and the adverse impact of fuel prices and currency exchange rate movements.
Volume softness in the Asia-to-U.S. trade lane in the latter half of 2011 resulted in excess transportation
capacity, which pressured margins while our transportation network was being adjusted for the slowing demand.
Fluctuations in foreign currency exchange rates (net of our hedging programs) resulted in an adverse impact on
operating profit comparisons between 2011 and 2010 of $123 million. Additionally, fuel prices adversely
impacted the operating profit comparison between 2011 and 2010, as fuel expense increased at a faster pace than
fuel surcharge revenue. These factors resulted in a decrease in the operating margin in 2011 compared with 2010.
2010 compared to 2009
The increase in operating profit for 2010 was primarily driven by volume increases in all major regions and
trade lanes worldwide. The shift in product mix to our higher-margin premium services also contributed to the
increase in operating profits. Additionally, network efficiencies and cost containment initiatives created operating
leverage throughout our operations. These factors led to an increase in the operating margin in 2010 compared
with 2009.
33