UPS 2011 Annual Report Download - page 41
Download and view the complete annual report
Please find page 41 of the 2011 UPS annual report below. You can navigate through the pages in the report by either clicking on the pages listed below, or by using the keyword search tool below to find specific information within the annual report.-
 1
1 -
2
-
3
-
4
-
5
-
6
-
7
-
8
-
9
-
10
-
11
-
12
-
13
-
14
-
15
-
16
-
17
-
18
-
19
-
20
-
21
-
22
-
23
-
24
-
25
-
26
-
27
-
28
-
29
-
30
-
 31
31 -
 32
32 -
 33
33 -
 34
34 -
 35
35 -
 36
36 -
 37
37 -
 38
38 -
 39
39 -
 40
40 -
 41
41 -
 42
42 -
 43
43 -
 44
44 -
 45
45 -
 46
46 -
 47
47 -
 48
48 -
 49
49 -
 50
50 -
 51
51 -
52
-
53
-
54
-
55
-
56
-
57
-
58
-
59
-
60
-
61
-
62
-
63
-
64
-
65
-
66
-
67
-
68
-
69
-
70
-
71
-
72
-
73
-
74
-
75
-
76
-
77
-
78
-
79
-
80
-
81
-
82
-
83
-
84
-
85
-
86
-
87
-
88
-
89
-
90
-
91
-
92
-
93
-
94
-
95
-
96
-
97
-
98
-
99
-
100
-
101
-
102
-
103
-
104
-
105
-
106
-
107
-
108
-
109
-
110
-
111
-
112
-
113
-
114
-
115
-
116
-
117
-
118
-
119
-
120
-
121
-
122
-
123
-
124
-
125
-
126
-
127
-
128
-
129
-
130
-
131
-
132
-
133
-
134
-
135
-
136
-
137
-
138
-
139
-
140
-
141
-
142
-
143
-
144
-
145
-
146
-
147
-
148
 |
 |

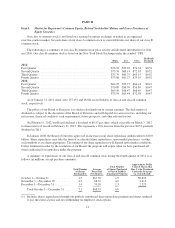
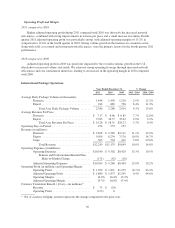
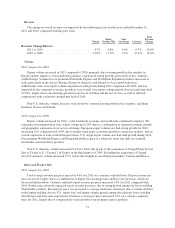
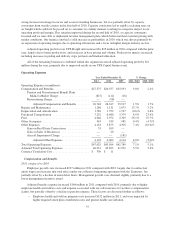
Fuel Surcharges
UPS applies a fuel surcharge on our domestic air and ground services. The air fuel surcharge is based on the
U.S. Department of Energy’s (“DOE”) Gulf Coast spot price for a gallon of kerosene-type jet fuel, while the
ground fuel surcharge is based on the DOE’s On-Highway Diesel Fuel Price. Based on published rates, the
average fuel surcharge for domestic air and ground products was as follows:
Year Ended December 31, % Point Change
2011 2010 2009 2011 / 2010 2010 / 2009
Next Day Air / Deferred ............. 13.3% 8.0% 4.0% 5.3% 4.0%
Ground ........................... 8.0% 5.6% 3.3% 2.4% 2.3%
In connection with our base rate increase on January 3, 2011, we modified the fuel surcharge on air and
ground services by reducing the index used to determine the fuel surcharge by 2% and 1%, respectively. In
connection with a base rate increase on January 4, 2010, we modified the fuel surcharge on air services by
reducing the index used to determine the fuel surcharge by 2%. The 2011 and 2010 increases in the air and
ground fuel surcharges were due to the significant increases in jet and diesel fuel prices each year, but partially
offset by the reductions in the index on the air and ground surcharges in 2011 and the index on the air surcharge
in 2010. Total domestic fuel surcharge revenue increased by $884 and $592 million in 2011 and 2010,
respectively, primarily due to the higher fuel surcharge rates discussed above.
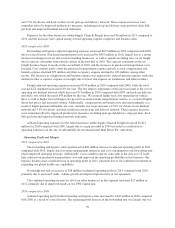
Operating Expenses
2011 compared to 2010
Overall adjusted operating expenses for the segment increased $975 million in 2011 compared with 2010,
while the total adjusted cost per piece increased 2.3% for the year. A large component of this increase relates to the
cost of operating our domestic integrated air and ground network, which increased $579 million in 2011 due largely
to higher fuel costs, as well as an increase in aircraft repair and maintenance expenses and higher rates passed to us
from outside transportation carriers, primarily railroads. Pickup and delivery costs increased $354 million in 2011
compared to 2010, primarily as a result of higher fuel prices and a 3.1% union contractual driver wage increase.
Cost increases have been mitigated due to network efficiencies that we have achieved, as we adjust our air
and ground networks to better match volume levels, and continued to utilize our expanded Worldport facility to
operate larger aircraft and to increase package sorting efficiency. These network efficiency improvements
resulted in a 0.8% reduction in total labor hours and a 0.8% reduction in miles driven in 2011 compared with
2010. Increased delivery densities as a result of improved planning and technology, and growth in our SurePost
product, have also contained increases in cost.
2010 compared to 2009
Overall adjusted operating expenses for the segment increased $426 million in 2010 compared with 2009,
while the total adjusted cost per piece decreased 0.2% for the year. Network costs increased $167 million in 2010
due largely to higher fuel costs. Pickup and delivery costs increased $148 million for the year, primarily as a
result of higher fuel prices and a 3.5% union contractual driver wage increase. Sort costs increased $59 million
for the year, largely due to contractual union wage increases as well as higher depreciation expense for certain
operating facilities, including our Worldport Hub.
Network efficiencies were achieved in 2010, as we adjusted our air and ground networks to better match volume
levels, and increased our package sorting efficiency. Improved pick-up and delivery densities also increased
productivity in our operations. These network efficiency improvements resulted in a 1.8% reduction in direct labor
hours, a 6.7% reduction in aircraft block hours and a 1.4% reduction in miles driven in 2010 compared with 2009. In
addition to these factors, management salary costs declined as a result of a decrease in the total number of
management employees through attrition combined with voluntary and involuntary workforce reductions.
29