UPS 2011 Annual Report Download - page 122
Download and view the complete annual report
Please find page 122 of the 2011 UPS annual report below. You can navigate through the pages in the report by either clicking on the pages listed below, or by using the keyword search tool below to find specific information within the annual report.-
 1
1 -
2
-
3
-
4
-
5
-
6
-
7
-
8
-
9
-
10
-
11
-
12
-
13
-
14
-
15
-
16
-
17
-
18
-
19
-
20
-
21
-
22
-
23
-
24
-
25
-
26
-
27
-
28
-
29
-
30
-
31
-
32
-
33
-
34
-
35
-
36
-
37
-
38
-
39
-
40
-
41
-
42
-
43
-
44
-
45
-
46
-
47
-
48
-
49
-
50
-
51
-
52
-
53
-
54
-
55
-
56
-
57
-
58
-
59
-
60
-
61
-
62
-
63
-
64
-
65
-
66
-
67
-
68
-
69
-
70
-
71
-
72
-
73
-
74
-
75
-
76
-
77
-
78
-
79
-
80
-
81
-
82
-
83
-
84
-
85
-
86
-
87
-
88
-
89
-
90
-
91
-
92
-
93
-
94
-
95
-
96
-
97
-
98
-
99
-
100
-
101
-
102
-
103
-
104
-
105
-
106
-
107
-
108
-
109
-
110
-
111
-
 112
112 -
 113
113 -
 114
114 -
 115
115 -
 116
116 -
 117
117 -
 118
118 -
 119
119 -
 120
120 -
 121
121 -
 122
122 -
 123
123 -
 124
124 -
 125
125 -
 126
126 -
 127
127 -
 128
128 -
 129
129 -
 130
130 -
 131
131 -
 132
132 -
133
-
134
-
135
-
136
-
137
-
138
-
139
-
140
-
141
-
142
-
143
-
144
-
145
-
146
-
147
-
148
 |
 |

UNITED PARCEL SERVICE, INC. AND SUBSIDIARIES
NOTES TO CONSOLIDATED FINANCIAL STATEMENTS—(Continued)
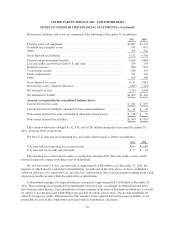
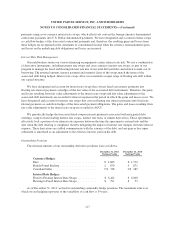
Geographic information as of, and for the years ended, December 31 is as follows (in millions):
2011 2010 2009
United States:
Revenue ...................................................... $39,347 $36,795 $34,375
Long-lived assets ............................................... $16,085 $16,693 $17,336
International:
Revenue ...................................................... $13,758 $12,750 $10,922
Long-lived assets ............................................... $ 5,220 $ 5,047 $ 4,935
Consolidated:
Revenue ...................................................... $53,105 $49,545 $45,297
Long-lived assets ............................................... $21,305 $21,740 $22,271
Long-lived assets include property, plant and equipment, pension and postretirement benefit assets, long-
term investments, goodwill, and intangible assets.
No countries outside of the United States, nor any individual customers, provided 10% or more of
consolidated revenue in 2011, 2010 or 2009.
NOTE 13. INCOME TAXES
The income tax expense (benefit) for the years ended December 31 consists of the following (in millions):
2011 2010 2009
Current:
U.S. Federal ...................................................... $1,371 $ 776 $ 715
U.S. State and Local ................................................ 121 119 30
Non-U.S. ......................................................... 166 161 147
Total Current ................................................. 1,658 1,056 892
Deferred:
U.S. Federal ...................................................... 262 828 137
U.S. State and Local ................................................ 44 98 21
Non-U.S. ......................................................... 8 (30) 55
Total Deferred ................................................ 314 896 213
Total ........................................................ $1,972 $1,952 $1,105
Income before income taxes includes the following components (in millions):
2011 2010 2009
United States ......................................................... $5,309 $4,586 $2,750
Non-U.S. ............................................................. 467 704 323
$5,776 $5,290 $3,073
110