UPS 2011 Annual Report Download - page 97
Download and view the complete annual report
Please find page 97 of the 2011 UPS annual report below. You can navigate through the pages in the report by either clicking on the pages listed below, or by using the keyword search tool below to find specific information within the annual report.-
 1
1 -
2
-
3
-
4
-
5
-
6
-
7
-
8
-
9
-
10
-
11
-
12
-
13
-
14
-
15
-
16
-
17
-
18
-
19
-
20
-
21
-
22
-
23
-
24
-
25
-
26
-
27
-
28
-
29
-
30
-
31
-
32
-
33
-
34
-
35
-
36
-
37
-
38
-
39
-
40
-
41
-
42
-
43
-
44
-
45
-
46
-
47
-
48
-
49
-
50
-
51
-
52
-
53
-
54
-
55
-
56
-
57
-
58
-
59
-
60
-
61
-
62
-
63
-
64
-
65
-
66
-
67
-
68
-
69
-
70
-
71
-
72
-
73
-
74
-
75
-
76
-
77
-
78
-
79
-
80
-
81
-
82
-
83
-
84
-
85
-
86
-
 87
87 -
 88
88 -
 89
89 -
 90
90 -
 91
91 -
 92
92 -
 93
93 -
 94
94 -
 95
95 -
 96
96 -
 97
97 -
 98
98 -
 99
99 -
 100
100 -
 101
101 -
 102
102 -
 103
103 -
 104
104 -
 105
105 -
 106
106 -
 107
107 -
108
-
109
-
110
-
111
-
112
-
113
-
114
-
115
-
116
-
117
-
118
-
119
-
120
-
121
-
122
-
123
-
124
-
125
-
126
-
127
-
128
-
129
-
130
-
131
-
132
-
133
-
134
-
135
-
136
-
137
-
138
-
139
-
140
-
141
-
142
-
143
-
144
-
145
-
146
-
147
-
148
 |
 |

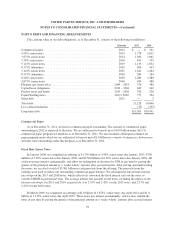
UNITED PARCEL SERVICE, INC. AND SUBSIDIARIES
NOTES TO CONSOLIDATED FINANCIAL STATEMENTS—(Continued)
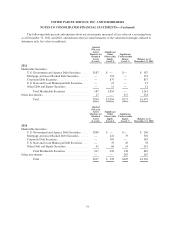
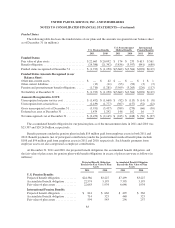
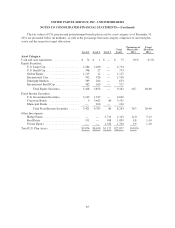
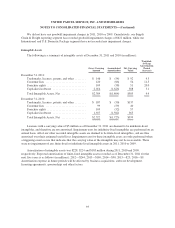
The fair values of U.S. pension and postretirement benefit plan assets by asset category as of December 31,
2011 are presented below (in millions), as well as the percentage that each category comprises of our total plan
assets and the respective target allocations.
Level 1 Level 2 Level 3
Total
Assets
Percentage of
Plan Assets -
2011
Target
Allocation
2011
Asset Category:
Cash and cash equivalents .................. $ 74 $ 1 $ — $ 75 0.3% 0-5%
Equity Securities:
U.S. Large Cap ....................... 2,264 2,460 — 4,724
U.S. Small Cap ....................... 706 27 — 733
Global Equity ........................ 1,115 12 — 1,127
International Core .................... 592 926 — 1,518
Emerging Markets .................... 389 264 — 653
International Small Cap ................ 362 165 — 527
Total Equity Securities ............. 5,428 3,854 — 9,282 40.7 40-60
Fixed Income Securities:
U.S. Government Securities ............. 3,412 1,217 — 4,629
Corporate Bonds ..................... 9 3,462 80 3,551
Municipal Bonds ..................... — 104 — 104
Total Fixed Income Securities ....... 3,421 4,783 80 8,284 36.3 20-40
Other Investments:
Hedge Funds ........................ — — 2,743 2,743 12.0 5-15
Real Estate .......................... 151 — 948 1,099 4.8 1-10
Private Equity ....................... — — 1,354 1,354 5.9 1-10
Total U.S. Plan Assets ..................... $9,074 $8,638 $5,125 $22,837 100.0%
85