UPS 2011 Annual Report Download - page 35
Download and view the complete annual report
Please find page 35 of the 2011 UPS annual report below. You can navigate through the pages in the report by either clicking on the pages listed below, or by using the keyword search tool below to find specific information within the annual report.-
 1
1 -
2
-
3
-
4
-
5
-
6
-
7
-
8
-
9
-
10
-
11
-
12
-
13
-
14
-
15
-
16
-
17
-
18
-
19
-
20
-
21
-
22
-
23
-
24
-
 25
25 -
 26
26 -
 27
27 -
 28
28 -
 29
29 -
 30
30 -
 31
31 -
 32
32 -
 33
33 -
 34
34 -
 35
35 -
 36
36 -
 37
37 -
 38
38 -
 39
39 -
 40
40 -
 41
41 -
 42
42 -
 43
43 -
 44
44 -
 45
45 -
46
-
47
-
48
-
49
-
50
-
51
-
52
-
53
-
54
-
55
-
56
-
57
-
58
-
59
-
60
-
61
-
62
-
63
-
64
-
65
-
66
-
67
-
68
-
69
-
70
-
71
-
72
-
73
-
74
-
75
-
76
-
77
-
78
-
79
-
80
-
81
-
82
-
83
-
84
-
85
-
86
-
87
-
88
-
89
-
90
-
91
-
92
-
93
-
94
-
95
-
96
-
97
-
98
-
99
-
100
-
101
-
102
-
103
-
104
-
105
-
106
-
107
-
108
-
109
-
110
-
111
-
112
-
113
-
114
-
115
-
116
-
117
-
118
-
119
-
120
-
121
-
122
-
123
-
124
-
125
-
126
-
127
-
128
-
129
-
130
-
131
-
132
-
133
-
134
-
135
-
136
-
137
-
138
-
139
-
140
-
141
-
142
-
143
-
144
-
145
-
146
-
147
-
148
 |
 |

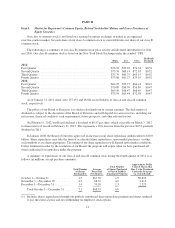
Item 6. Selected Financial Data
Information in Items 6, 7, 8 and Exhibit 12 of this report for the years ended December 31, 2011, 2010,
2009, 2008 and 2007 have been revised, as applicable, for the retrospective application of our changes in
accounting policies for recognizing the expense associated with our pension and postretirement benefit plans.
These changes in accounting policies are further discussed in Note 1 to the audited consolidated financial
statements.
The following table sets forth selected financial data for each of the five years in the period ended
December 31, 2011 (in millions, except per share amounts). This financial data should be read together with our
consolidated financial statements and related notes, Management’s Discussion and Analysis of Financial
Condition and Results of Operations, and other financial data appearing elsewhere in this report.
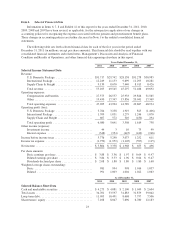
Years Ended December 31,
2011 2010 2009 2008 2007
Selected Income Statement Data
Revenue:
U.S. Domestic Package ......................... $31,717 $29,742 $28,158 $31,278 $30,985
International Package ........................... 12,249 11,133 9,699 11,293 10,281
Supply Chain & Freight ......................... 9,139 8,670 7,440 8,915 8,426
Total revenue ................................. 53,105 49,545 45,297 51,486 49,692
Operating expenses:
Compensation and benefits ...................... 27,575 26,557 25,933 29,826 31,565
Other ........................................ 19,450 17,347 15,856 20,041 17,369
Total operating expenses ........................ 47,025 43,904 41,789 49,867 48,934
Operating profit (loss):
U.S. Domestic Package ......................... 3,764 3,238 1,919 823 (1,406)
International Package ........................... 1,709 1,831 1,279 1,246 1,870
Supply Chain and Freight ........................ 607 572 310 (450) 294
Total operating profit ........................... 6,080 5,641 3,508 1,619 758
Other income (expense):
Investment income ............................. 44 3 10 75 99
Interest expense ............................... (348) (354) (445) (442) (246)
Income before income taxes .......................... 5,776 5,290 3,073 1,252 611
Income tax expense ................................ (1,972) (1,952) (1,105) (597) (115)
Net income ....................................... $ 3,804 $ 3,338 $ 1,968 $ 655 $ 496
Per share amounts:
Basic earnings per share ......................... $ 3.88 $ 3.36 $ 1.97 $ 0.64 $ 0.47
Diluted earnings per share ....................... $ 3.84 $ 3.33 $ 1.96 $ 0.64 $ 0.47
Dividends declared per share ..................... $ 2.08 $ 1.88 $ 1.80 $ 1.80 $ 1.68
Weighted average shares outstanding:
Basic ........................................ 981 994 998 1,016 1,057
Diluted ...................................... 991 1,003 1,004 1,022 1,063
As of December 31,
2011 2010 2009 2008 2007
Selected Balance Sheet Data
Cash and marketable securities ....................... $ 4,275 $ 4,081 $ 2,100 $ 1,049 $ 2,604
Total assets ....................................... 34,701 33,597 31,883 31,879 39,042
Long-term debt .................................... 11,095 10,491 8,668 7,797 7,506
Shareowners’ equity ................................ 7,108 8,047 7,696 6,780 12,183
23