UPS 2011 Annual Report Download - page 49
Download and view the complete annual report
Please find page 49 of the 2011 UPS annual report below. You can navigate through the pages in the report by either clicking on the pages listed below, or by using the keyword search tool below to find specific information within the annual report.-
 1
1 -
2
-
3
-
4
-
5
-
6
-
7
-
8
-
9
-
10
-
11
-
12
-
13
-
14
-
15
-
16
-
17
-
18
-
19
-
20
-
21
-
22
-
23
-
24
-
25
-
26
-
27
-
28
-
29
-
30
-
31
-
32
-
33
-
34
-
35
-
36
-
37
-
38
-
 39
39 -
 40
40 -
 41
41 -
 42
42 -
 43
43 -
 44
44 -
 45
45 -
 46
46 -
 47
47 -
 48
48 -
 49
49 -
 50
50 -
 51
51 -
 52
52 -
 53
53 -
 54
54 -
 55
55 -
 56
56 -
 57
57 -
 58
58 -
 59
59 -
60
-
61
-
62
-
63
-
64
-
65
-
66
-
67
-
68
-
69
-
70
-
71
-
72
-
73
-
74
-
75
-
76
-
77
-
78
-
79
-
80
-
81
-
82
-
83
-
84
-
85
-
86
-
87
-
88
-
89
-
90
-
91
-
92
-
93
-
94
-
95
-
96
-
97
-
98
-
99
-
100
-
101
-
102
-
103
-
104
-
105
-
106
-
107
-
108
-
109
-
110
-
111
-
112
-
113
-
114
-
115
-
116
-
117
-
118
-
119
-
120
-
121
-
122
-
123
-
124
-
125
-
126
-
127
-
128
-
129
-
130
-
131
-
132
-
133
-
134
-
135
-
136
-
137
-
138
-
139
-
140
-
141
-
142
-
143
-
144
-
145
-
146
-
147
-
148
 |
 |

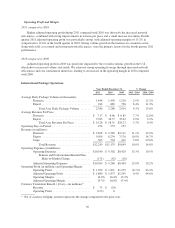
strong increase in tonnage in our air and ocean forwarding businesses, but was partially offset by capacity
constraints from outside carriers in the first half of 2010. Capacity constraints led to rapidly escalating rates on
air freight which could not be passed on to customers in a timely manner, resulting in a negative impact to our
operating profit and margin. This situation improved during the second half of 2010, as capacity constraints
lessened and we were able to implement revenue management plans which better matched customer pricing with
market conditions. Our logistics unit had a solid increase in profitability in 2010, which was driven primarily by
an expansion of operating margins due to operating efficiencies and a focus on higher margin industry sectors.
Adjusted operating profit for our UPS Freight unit increased by $25 million in 2010 compared with the prior
year, largely due to better productivity, and increases in base pricing and volume. Productivity metrics increased,
including increases in pickup and delivery stops per hour and linehaul utilization.
All of the remaining businesses combined within this segment increased adjusted operating profit by $11
million during the year, primarily due to improved results in our UPS Capital business unit.
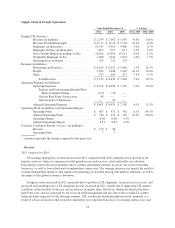
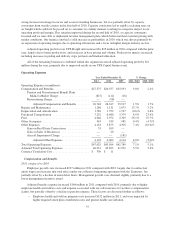
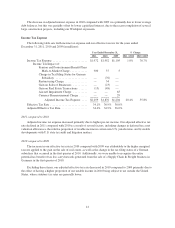
Operating Expenses
Year Ended December 31, % Change
2011 2010 2009 2011 / 2010 2010 / 2009
Operating Expenses (in millions):
Compensation and Benefits ........................ $27,575 $26,557 $25,933 3.8% 2.4%
Pension and Postretirement Benefit Plans
Mark-to-Market Charge ..................... (827) (112) (16)
Restructuring Charge ......................... — (98) —
Adjusted Compensation and Benefits ........ 26,748 26,347 25,917 1.5% 1.7%
Repairs and Maintenance .......................... 1,286 1,131 1,075 13.7% 5.2%
Depreciation and Amortization ..................... 1,782 1,792 1,747 (0.6)% 2.6%
Purchased Transportation ......................... 7,232 6,640 5,379 8.9% 23.4%
Fuel .......................................... 4,046 2,972 2,365 36.1% 25.7%
Other Occupancy ................................ 943 939 985 0.4% (4.7)%
Other Expenses ................................. 4,161 3,873 4,305 7.4% (10.0)%
Gain on Real Estate Transactions ............... 33 109 —
Gain on Sales of Businesses ................... — 20 —
Aircraft Impairment Charge ................... — — (181)
Adjusted Other Expenses .................. 4,194 4,002 4,124 4.8% (3.0)%
Total Operating Expenses ......................... $47,025 $43,904 $41,789 7.1% 5.1%
Adjusted Total Operating Expenses ................. 46,231 43,823 41,592 5.5% 5.4%
Currency Translation Cost ......................... $ 330 $ 11
Compensation and Benefits
2011 compared to 2010
Employee payroll costs increased $237 million in 2011 compared with 2010, largely due to contractual
union wage rate increases that took effect under our collective bargaining agreement with the Teamsters, but
partially offset by a decline in union labor hours. Management payroll costs declined slightly primarily due to a
lower management incentive award.
Adjusted benefits expense increased $164 million in 2011 compared with 2010, primarily due to higher
employee health and welfare costs and expense associated with our self-insurance for worker’s compensation
claims, but partially offset by a decline in pension expense. These factors are discussed further as follows:
• Employee health and welfare program costs increased $132 million in 2011, and were impacted by
higher required union plan contribution rates and general health care inflation.
37