UPS 2011 Annual Report Download - page 44
Download and view the complete annual report
Please find page 44 of the 2011 UPS annual report below. You can navigate through the pages in the report by either clicking on the pages listed below, or by using the keyword search tool below to find specific information within the annual report.-
 1
1 -
2
-
3
-
4
-
5
-
6
-
7
-
8
-
9
-
10
-
11
-
12
-
13
-
14
-
15
-
16
-
17
-
18
-
19
-
20
-
21
-
22
-
23
-
24
-
25
-
26
-
27
-
28
-
29
-
30
-
31
-
32
-
33
-
 34
34 -
 35
35 -
 36
36 -
 37
37 -
 38
38 -
 39
39 -
 40
40 -
 41
41 -
 42
42 -
 43
43 -
 44
44 -
 45
45 -
 46
46 -
 47
47 -
 48
48 -
 49
49 -
 50
50 -
 51
51 -
 52
52 -
 53
53 -
 54
54 -
55
-
56
-
57
-
58
-
59
-
60
-
61
-
62
-
63
-
64
-
65
-
66
-
67
-
68
-
69
-
70
-
71
-
72
-
73
-
74
-
75
-
76
-
77
-
78
-
79
-
80
-
81
-
82
-
83
-
84
-
85
-
86
-
87
-
88
-
89
-
90
-
91
-
92
-
93
-
94
-
95
-
96
-
97
-
98
-
99
-
100
-
101
-
102
-
103
-
104
-
105
-
106
-
107
-
108
-
109
-
110
-
111
-
112
-
113
-
114
-
115
-
116
-
117
-
118
-
119
-
120
-
121
-
122
-
123
-
124
-
125
-
126
-
127
-
128
-
129
-
130
-
131
-
132
-
133
-
134
-
135
-
136
-
137
-
138
-
139
-
140
-
141
-
142
-
143
-
144
-
145
-
146
-
147
-
148
 |
 |
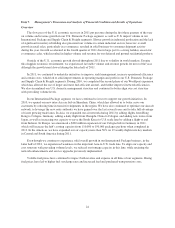
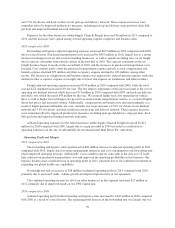
On January 3, 2011, we increased the base rates 6.9% for international shipments originating in the United
States (Worldwide Express, Worldwide Express Plus, UPS Worldwide Expedited and UPS International
Standard service), while reducing fuel surcharge indexes. Rate changes for shipments originating outside the U.S.
are made throughout the year and vary by geographic market.
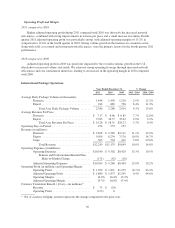
2010 compared to 2009
Export revenue per piece increased during 2010, largely due to higher fuel surcharge rates, base rate
increases and product mix. Export revenue per piece increased as higher-yielding products (such as Worldwide
Express and Worldwide Expedited) grew at a relatively faster pace. In 2010, we experienced an overall
lengthening of trade lanes, as inter-regional trade increased (especially in our Asia-to-Europe and Asia-to-U.S.
export lanes), leading to relatively stronger growth for our premium products. The impact of currency, net of
hedging, resulted in a decrease to revenue growth during the year. Domestic revenue per piece decreased,
primarily due to the impact of lower-yielding domestic packages from the Unsped acquisition. Total average
revenue per piece increased 0.7% for the year on a currency-adjusted basis.
On January 4, 2010, we increased the base rates 6.9% for international shipments originating in the United
States (Worldwide Express, Worldwide Express Plus, UPS Worldwide Expedited and UPS International
Standard service). Rate changes for shipments originating outside the U.S. were made throughout the year and
varied by geographic market.
Fuel Surcharges
In connection with our base rate increases on January 3, 2011 and January 4, 2010, we modified the fuel
surcharges on certain U.S.-related international air services by reducing the index used to determine the fuel
surcharge by 2% in each of the two years. The fuel surcharges for products originating outside the United States
continue to be indexed to fuel prices in the international region where the shipment takes place. Total
international fuel surcharge revenue increased by $449 and $299 million in 2011 and 2010, respectively, due to
higher fuel surcharge rates caused by increased fuel prices as well as an increase in international air volume.
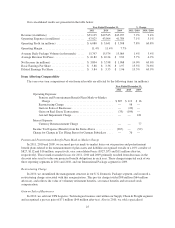
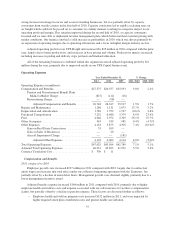
Operating Expenses
2011 compared to 2010
Overall adjusted operating expenses for the segment increased $1.109 billion in 2011 compared with 2010.
The impact of foreign currency exchange rate changes resulted in an adverse impact on operating expense
comparisons between 2011 and 2010 of $198 million. Excluding the impact of currency exchange rate changes,
the total adjusted cost per piece for the segment increased 4.7% for the year.
The increase in adjusted operating expenses, excluding the impact of currency, was largely due to the
increased cost of operating our international integrated air and ground network, and also higher pick-up and
delivery costs. Network costs increased $745 million for the year, largely due to higher fuel costs and increased
block hours, as well as an increase in aircraft repair and maintenance expenses. Pick-up and delivery costs
increased $123 million for the year, primarily as a result of higher fuel prices and increased package volume.
2010 compared to 2009
Overall adjusted operating expenses for the segment increased $856 million in 2010 compared with 2009.
The impact of foreign currency exchange rate changes resulted in a favorable impact on operating expense
comparisons between 2010 and 2009 of $30 million. Excluding the impact of currency exchange rate changes,
the total adjusted cost per piece for the segment decreased 2.6% for the year.
The increase in adjusted operating expenses, excluding the impact of currency, was primarily due to the cost
of operating our international integrated air and ground network, as well as pick-up and delivery costs and
32