Rogers 2009 Annual Report Download - page 96
Download and view the complete annual report
Please find page 96 of the 2009 Rogers annual report below. You can navigate through the pages in the report by either clicking on the pages listed below, or by using the keyword search tool below to find specific information within the annual report.-
 1
1 -
2
-
3
-
4
-
5
-
6
-
7
-
8
-
9
-
10
-
11
-
12
-
13
-
14
-
15
-
16
-
17
-
18
-
19
-
20
-
21
-
22
-
23
-
24
-
25
-
26
-
27
-
28
-
29
-
30
-
31
-
32
-
33
-
34
-
35
-
36
-
37
-
38
-
39
-
40
-
41
-
42
-
43
-
44
-
45
-
46
-
47
-
48
-
49
-
50
-
51
-
52
-
53
-
54
-
55
-
56
-
57
-
58
-
59
-
60
-
61
-
62
-
63
-
64
-
65
-
66
-
67
-
68
-
69
-
70
-
71
-
72
-
73
-
74
-
75
-
76
-
77
-
78
-
79
-
80
-
81
-
82
-
83
-
84
-
85
-
 86
86 -
 87
87 -
 88
88 -
 89
89 -
 90
90 -
 91
91 -
 92
92 -
 93
93 -
 94
94 -
 95
95 -
 96
96 -
 97
97 -
 98
98 -
 99
99 -
 100
100 -
 101
101 -
 102
102 -
 103
103 -
 104
104 -
 105
105 -
 106
106 -
107
-
108
-
109
-
110
-
111
-
112
-
113
-
114
-
115
-
116
-
117
-
118
-
119
-
120
-
121
-
122
-
123
-
124
-
125
-
126
-
127
-
128
-
129
-
130
 |
 |

100 ROGERS COMMUNICATIONS INC. 2009 ANNUAL REPORT
NOTES TO CONSOLIDATED FINANCIAL STATEMENTS
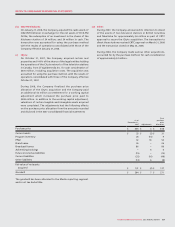
During 2009, the Company released $64 million of its valuation
allowance as an income tax recovery in the consolidated statements
of income. Of this amount, $14 million relates to a decrease of future
tax assets in foreign jurisdictions arising from foreign exchange
fluctuations and the remaining $50 million relates to unrealized
gains on investments and financial instruments.
During 2008, the Company recorded an increase in its valuation
allowance of $25 million. Of this increase, $19 million relates to
future tax assets in foreign jurisdictions and was recorded as an
increase in income tax expense in the consolidated statements of
income. The remaining $6 million relates primarily to unrealized
losses on investments and financial instruments and was charged to
other comprehensive income.
During 2008, the Company recorded the benefit of an income tax
credit of $65 million arising from the harmonization of the Ontario
provincial income tax system with the Canadian federal income tax
system. The resulting income tax credit will be available to reduce
future Ontario income taxes until 2013.
Income taxes payable of $207 million (2008 – $1 million) is included
in accounts payable and accrued liabilities.
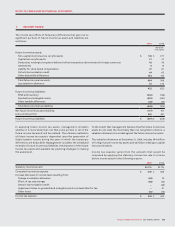
As at December 31, 2009, the Company has the following Canadian
non-capital income tax losses available to reduce future years’
income for income tax purposes:
Income tax losses expiring in the year ending December 31:
2010 $ 17
2011 – 2014 –
Thereafter 353
$ 370
In addition to the amounts above, as at December 31, 2009, the
Company had approximately $73 million in non-capital income tax
losses in foreign subsidiaries expiring between 2023 and 2028.
As at December 31, 2009, the Company had approximately
$246 million of available capital losses to offset future capital gains.
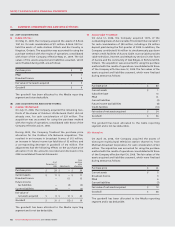
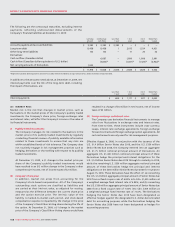
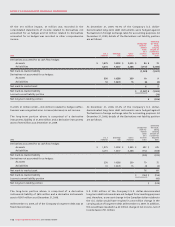
The following table sets forth the calculation of basic and diluted
net income per share:
8. NET INCOME PER SHARE:
9. OTHER CURRENT ASSETS:
2009 2008
Numerator:
Net income for the year, basic and diluted $ 1,478 $ 1,002
Denominator (in millions):
Weighted average number of shares outstanding – basic and diluted 621 638
Basic and diluted net income per share $ 2.38 $ 1.57
2009 2008
Inventories $ 129 $ 256
Prepaid expenses 110 99
Acquired program rights 61 43
Rogers Retail rental inventory 27 29
Deferred compensation 10 12
Other 13
$ 338 $ 442
Amortization expense for Rogers Retail rental inventory is charged
to cost of sales and amounted to $43 million in 2009 (2008 – $43
million). The costs of acquired program rights are amortized to
operating, general and administrative expenses over the expected
performances of the related programs and amounted to $131
million in 2009 (2008 – $103 million). Cost of sales includes $1,337
million (2008 – $1,260 million) of inventory costs.