Rogers 2009 Annual Report Download - page 12
Download and view the complete annual report
Please find page 12 of the 2009 Rogers annual report below. You can navigate through the pages in the report by either clicking on the pages listed below, or by using the keyword search tool below to find specific information within the annual report.-
 1
1 -
 2
2 -
 3
3 -
 4
4 -
 5
5 -
 6
6 -
 7
7 -
 8
8 -
 9
9 -
 10
10 -
 11
11 -
 12
12 -
 13
13 -
 14
14 -
 15
15 -
 16
16 -
 17
17 -
 18
18 -
 19
19 -
 20
20 -
 21
21 -
 22
22 -
23
-
24
-
25
-
26
-
27
-
28
-
29
-
30
-
31
-
32
-
33
-
34
-
35
-
36
-
37
-
38
-
39
-
40
-
41
-
42
-
43
-
44
-
45
-
46
-
47
-
48
-
49
-
50
-
51
-
52
-
53
-
54
-
55
-
56
-
57
-
58
-
59
-
60
-
61
-
62
-
63
-
64
-
65
-
66
-
67
-
68
-
69
-
70
-
71
-
72
-
73
-
74
-
75
-
76
-
77
-
78
-
79
-
80
-
81
-
82
-
83
-
84
-
85
-
86
-
87
-
88
-
89
-
90
-
91
-
92
-
93
-
94
-
95
-
96
-
97
-
98
-
99
-
100
-
101
-
102
-
103
-
104
-
105
-
106
-
107
-
108
-
109
-
110
-
111
-
112
-
113
-
114
-
115
-
116
-
117
-
118
-
119
-
120
-
121
-
122
-
123
-
124
-
125
-
126
-
127
-
128
-
129
-
130
 |
 |
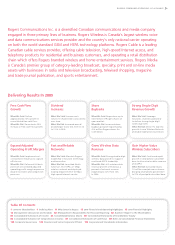
16 ROGERS COMMUNICATIONS INC. 2009 ANNUAL REPORT
2009 Financial Highlights
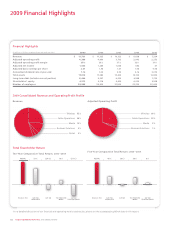
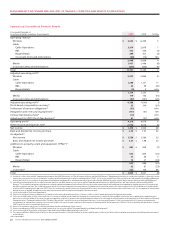
Financial Highlights
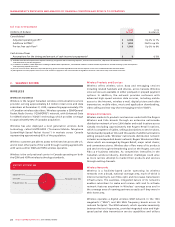
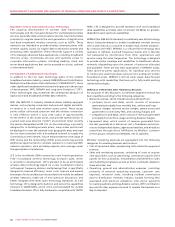
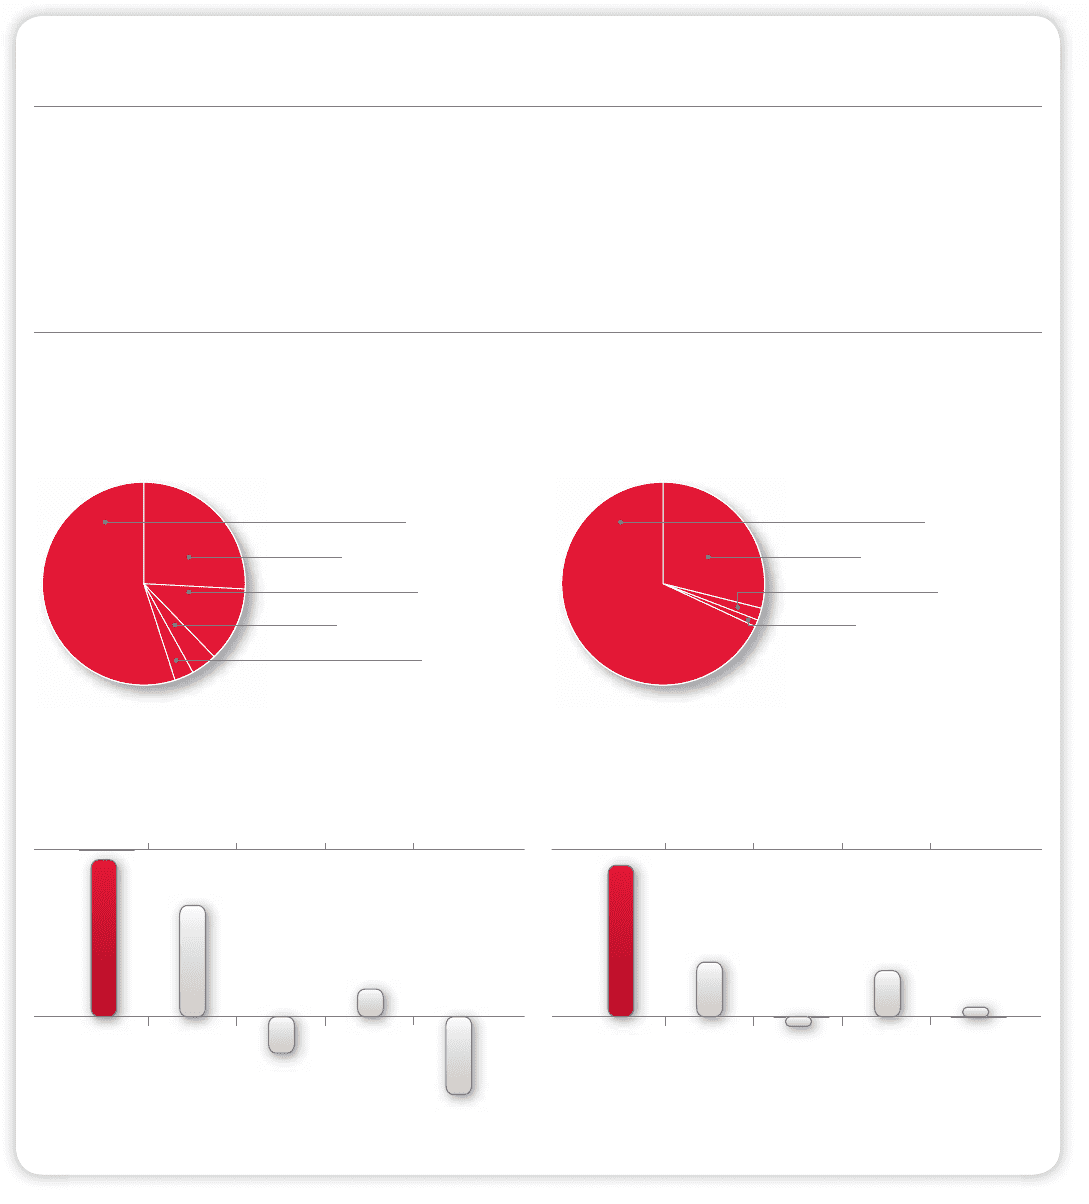
2009 Consolidated Revenue and Operating Profit Profile
(In millions of dollars, except per share and employee data) 2009 2008 2007 2006 2005
Revenue $ 11,731 $ 11,335 $ 10,123 $ 8,838 $ 7,334
Adjusted operating profit 4,388 4,060 3,703 2,942 2,252
Adjusted operating profit margin 37% 36% 37% 33% 31%
Adjusted net income 1,556 1,260 1,066 684 47
Adjusted basic earnings per share 2.51 1.98 1.67 1.08 0.08
Annualized dividend rate at year-end 1.16 1.00 0.50 0.16 0.075
Total assets 17,018 17,082 15,325 14,105 13,834
Long-term debt (includes current portion) 8,464 8,507 6,033 6,988 7,739
Shareholders‘ equity 4,273 4,716 4,624 4,200 3,528
Number of employees 28,985 29,200 27,900 25,700 22,600
Adjusted Operating ProfitRevenue
For a detailed discussion of our financial and operating metrics and results, please see the accompanying MD&A later in this report.
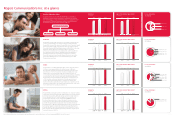
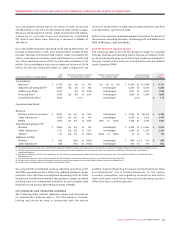
Five-Year Comparative Total Return: 2005–2009
Total Shareholder Return
(24%)73%103%
S&P 500S&P/TSX
COMPOSITE
RCI.b on TSX TSX TELECOM
INDEX S&P 500
TELECOM INDEX
18% (51%)
S&P 500
Ten-Year Comparative Total Return: 2000–2009
(8%)45%125% 38% 8%
S&P 500S&P/TSX
COMPOSITE
RCI.b on TSX TSX TELECOM
INDEX S&P 500
TELECOM INDEX
55%Wireless
26%Cable Operations
4%Business Solutions
3%Retail
12%Media
68%Wireless
29%Cable Operations
1%Business Solutions
2%Media