Rogers 2009 Annual Report Download - page 23
Download and view the complete annual report
Please find page 23 of the 2009 Rogers annual report below. You can navigate through the pages in the report by either clicking on the pages listed below, or by using the keyword search tool below to find specific information within the annual report.-
 1
1 -
2
-
3
-
4
-
5
-
6
-
7
-
8
-
9
-
10
-
11
-
12
-
 13
13 -
 14
14 -
 15
15 -
 16
16 -
 17
17 -
 18
18 -
 19
19 -
 20
20 -
 21
21 -
 22
22 -
 23
23 -
 24
24 -
 25
25 -
 26
26 -
 27
27 -
 28
28 -
 29
29 -
 30
30 -
 31
31 -
 32
32 -
 33
33 -
34
-
35
-
36
-
37
-
38
-
39
-
40
-
41
-
42
-
43
-
44
-
45
-
46
-
47
-
48
-
49
-
50
-
51
-
52
-
53
-
54
-
55
-
56
-
57
-
58
-
59
-
60
-
61
-
62
-
63
-
64
-
65
-
66
-
67
-
68
-
69
-
70
-
71
-
72
-
73
-
74
-
75
-
76
-
77
-
78
-
79
-
80
-
81
-
82
-
83
-
84
-
85
-
86
-
87
-
88
-
89
-
90
-
91
-
92
-
93
-
94
-
95
-
96
-
97
-
98
-
99
-
100
-
101
-
102
-
103
-
104
-
105
-
106
-
107
-
108
-
109
-
110
-
111
-
112
-
113
-
114
-
115
-
116
-
117
-
118
-
119
-
120
-
121
-
122
-
123
-
124
-
125
-
126
-
127
-
128
-
129
-
130
 |
 |

ROGERS COMMUNICATIONS INC. 2009 ANNUAL REPORT 27
MANAGEMENT’S DISCUSSION AND ANALYSIS OF FINANCIAL CONDITION AND RESULTS OF OPERATIONS
Wireless Operating Highlights for the Year Ended
December 31, 2009
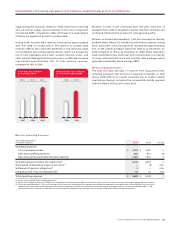
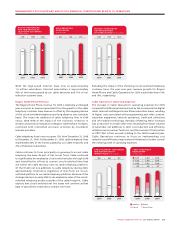
• Networkrevenueincreasedby7%to$6,245millionin2009from
$5,843 million in 2008.
• Strong subscriber grow th continued in 2009, with net
additions of 552,000, of which approximately 95% were postpaid
subscribers.
• Postpaidsubscribermonthlychurnwas1.06%in2009,compared
to 1.10% in 2008.
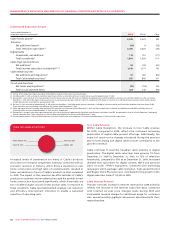
• Postpaidmonthlyaveragerevenueperuser(“ARPU”)decreased
2.0% from 2008 to $73.93, reflecting the impact of competitive
intensity and declines in roaming and out-of-plan usage revenues
as customers reduce travel and adjust their wireless usage during
the economic recession, which offset the significant growth in
wireless data revenue.
• Revenuesfromwirelessdataservicesgrewapproximately44%
year-over-year to $1,366 million in 2009 from $946 million in
2008, and represented approximately 22% of network revenue
compared to 16% in 2008.
• Wirelessactivatedapproximately1,450,000smartphonedevices
during the year, predominantly iPhone, BlackBerry and Android
devices. Approximately 45% of these activations were for
subscribers new to Wireless and 55% being for existing Wireless
subscribers who upgraded to smartphones and committed
to new term contracts. Subscribers with smartphones now
represent approximately 31% of the overall postpaid subscriber
base, up from 19% from last year, and generate average ARPU
nearly twice that of voice only subscribers.
• Wireless launched the next generation Apple iPhone 3GS in
Canada which offers speeds up to two times faster than the
previous iPhone 3G with download speeds of up to 7.2 Mbps.
Wireless also launched the first two Android operating system
powered smartphones in Canada featuring built-in integration
with many of Google’s leading mobile services including the
Android Market, which features thousands of downloadable
mobile applications.
• WirelessannouncedthecommercialavailabilityofRogers’ next
generation high-speed HSPA+ network to approximately 85% of
Canadians across major Canadian cities, with maximum speeds of
up to 21 Mbps.
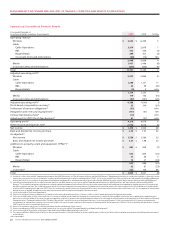
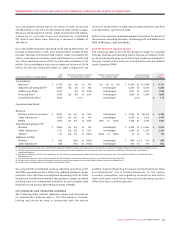
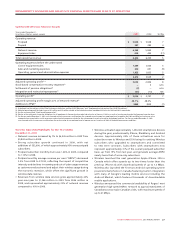
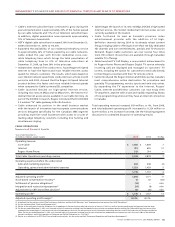
Summarized Wireless Financial Results
Years ended December 31,
(In millions of dollars, except margin) 2009 2008 %Chg
Operating revenue
Postpaid $ 5,948 $ 5,558 7
Prepaid 297 285 4
Network revenue 6,245 5,843 7
Equipment sales 409 492 (17)
Total operating revenue 6,654 6,335 5
Operating expenses before the undernoted
Cost of equipment sales 1,059 1,005 5
Sales and marketing expenses 630 691 (9)
Operating, general and administrative expenses 1,923 1,833 5
3,612 3,529 2
Adjusted operating profit(1)(2) 3,042 2,806 8
Stock-based compensation recovery (expense)(3) – 5 n/m
Settlement of pension obligations(4) (3) – n/m
Integration and restructuring expenses(5) (33) (14) 136
Operating profit(1) $ 3,006 $ 2,797 7
Adjusted operating profit margin as % of network revenue(1) 48.7% 48.0%
Additions to PP&E(1) $865 $929 (7)
(1) As defined. See the sections entitled “Key Performance Indicators and Non-GAAP Measures” and “Supplementary Information: Non-GAAP Calculations”.
(2) Adjusted operating profit includes losses of $13 million and $14 million related to the Inukshuk wireless broadband initiative for 2009 and 2008, respectively.
(3) See the section entitled “Stock-based Compensation”.
(4) Relates to the settlement of pension obligations for all employees in the pension plans who had retired as of January 1, 2009 as a result of annuity purchases by the Company’s pension plans.
(5) For the year ended December 31, 2009, costs incurred relate to severances resulting from the targeted restructuring of our employee base to combine the Cable and Wireless businesses into a
communications organization and to severances and restructuring expenses related to the outsourcing of certain information technology functions. For the year ended December 31, 2008,
costs incurred relate to severances resulting from the restructuring of our employee base to improve our cost structure in light of the declining economic conditions.