Rogers 2009 Annual Report Download - page 108
Download and view the complete annual report
Please find page 108 of the 2009 Rogers annual report below. You can navigate through the pages in the report by either clicking on the pages listed below, or by using the keyword search tool below to find specific information within the annual report.-
 1
1 -
2
-
3
-
4
-
5
-
6
-
7
-
8
-
9
-
10
-
11
-
12
-
13
-
14
-
15
-
16
-
17
-
18
-
19
-
20
-
21
-
22
-
23
-
24
-
25
-
26
-
27
-
28
-
29
-
30
-
31
-
32
-
33
-
34
-
35
-
36
-
37
-
38
-
39
-
40
-
41
-
42
-
43
-
44
-
45
-
46
-
47
-
48
-
49
-
50
-
51
-
52
-
53
-
54
-
55
-
56
-
57
-
58
-
59
-
60
-
61
-
62
-
63
-
64
-
65
-
66
-
67
-
68
-
69
-
70
-
71
-
72
-
73
-
74
-
75
-
76
-
77
-
78
-
79
-
80
-
81
-
82
-
83
-
84
-
85
-
86
-
87
-
88
-
89
-
90
-
91
-
92
-
93
-
94
-
95
-
96
-
97
-
 98
98 -
 99
99 -
 100
100 -
 101
101 -
 102
102 -
 103
103 -
 104
104 -
 105
105 -
 106
106 -
 107
107 -
 108
108 -
 109
109 -
 110
110 -
 111
111 -
 112
112 -
 113
113 -
 114
114 -
 115
115 -
 116
116 -
 117
117 -
 118
118 -
119
-
120
-
121
-
122
-
123
-
124
-
125
-
126
-
127
-
128
-
129
-
130
 |
 |

112 ROGERS COMMUNICATIONS INC. 2009 ANNUAL REPORT
NOTES TO CONSOLIDATED FINANCIAL STATEMENTS
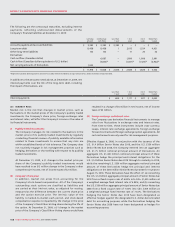
(iii) Fair values:
The Company has determined the fair values of its financial
instruments as follows:
(a) The carrying amounts in the consolidated balance sheets
of cash and cash equivalents, accounts receivable, bank
advances arising from outstanding cheques and accounts
payable and accrued liabilities approximate fair values
because of the short-term nature of these financial
instruments.
(b) The fair values of investments that are publicly traded are
determined by the quoted market values for each of the
investments.
(c) The fair values of each of the Company’s public debt
instruments are based on the year-end trading values.
(d) The fair values of the Company’s Derivatives and
other derivative instruments are based on estimated
mark-to-market value at year-end and credit-adjusted
mark-to-market valuation models.
(e) The fair values of the Company’s other long-term financial
assets and financial liabilities are not significantly different
from their carrying amounts.
Fair value estimates are made at a specific point in time, based on
relevant market information and information about the financial
instruments. These estimates are subjective in nature and involve
uncertainties and matters of significant judgment and, therefore,
cannot be determined with precision. Changes in assumptions
could significantly affect the estimates.
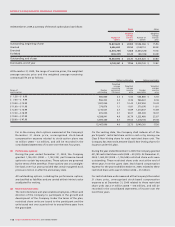
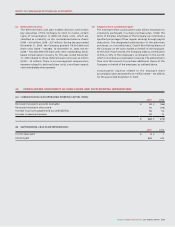
The table below presents the Level in the fair value hierarchy into
which the fair values of financial instruments that are carried at fair
value on the consolidated balance sheets are categorized:
There were no financial instruments categorized in Level 3
(valuation technique using non-observable market inputs) as at
December 31, 2009.
Level 1 Level 2
Quoted
market
price
Valuation
technique
using
observable
market inputs
Financial assets:
Cash and cash equivalents $ 383 $ –
Investments 496 –
Derivatives accounted for as cash flow hedges –73
Derivatives not accounted for as hedges – 9
Total financial assets $ 879 $ 82
Financial liabilities:
Derivatives accounted for as cash flow hedges $ – $ 1,080
Derivatives not accounted for as hedges – 4
Total financial liabilities $ – $ 1,084
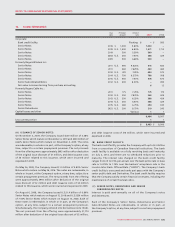
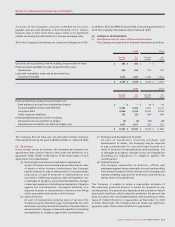
16. OTHER LONG-TERM LIABILITIES:
2009 2008
CRTC commitments (note 13) $ 45 $ 63
Deferred compensation 18 33
Program rights liability 11 29
Supplemental executive retirement plan (note 17) 29 26
Deferred gain on contribution of spectrum licences,
net of accumulated amortization of $10 million (2008 – $6 million) (note 5) 14 18
Restricted share units 12 9
Liabilities related to stock options 22
Other 24
$ 133 $ 184