Rogers 2009 Annual Report Download - page 38
Download and view the complete annual report
Please find page 38 of the 2009 Rogers annual report below. You can navigate through the pages in the report by either clicking on the pages listed below, or by using the keyword search tool below to find specific information within the annual report.-
 1
1 -
2
-
3
-
4
-
5
-
6
-
7
-
8
-
9
-
10
-
11
-
12
-
13
-
14
-
15
-
16
-
17
-
18
-
19
-
20
-
21
-
22
-
23
-
24
-
25
-
26
-
27
-
 28
28 -
 29
29 -
 30
30 -
 31
31 -
 32
32 -
 33
33 -
 34
34 -
 35
35 -
 36
36 -
 37
37 -
 38
38 -
 39
39 -
 40
40 -
 41
41 -
 42
42 -
 43
43 -
 44
44 -
 45
45 -
 46
46 -
 47
47 -
 48
48 -
49
-
50
-
51
-
52
-
53
-
54
-
55
-
56
-
57
-
58
-
59
-
60
-
61
-
62
-
63
-
64
-
65
-
66
-
67
-
68
-
69
-
70
-
71
-
72
-
73
-
74
-
75
-
76
-
77
-
78
-
79
-
80
-
81
-
82
-
83
-
84
-
85
-
86
-
87
-
88
-
89
-
90
-
91
-
92
-
93
-
94
-
95
-
96
-
97
-
98
-
99
-
100
-
101
-
102
-
103
-
104
-
105
-
106
-
107
-
108
-
109
-
110
-
111
-
112
-
113
-
114
-
115
-
116
-
117
-
118
-
119
-
120
-
121
-
122
-
123
-
124
-
125
-
126
-
127
-
128
-
129
-
130
 |
 |
42 ROGERS COMMUNICATIONS INC. 2009 ANNUAL REPORT
MANAGEMENT’S DISCUSSION AND ANALYSIS OF FINANCIAL CONDITION AND RESULTS OF OPERATIONS
20092008
2007
2008
2007
2009
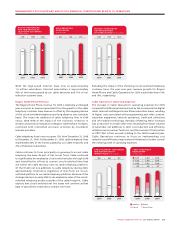
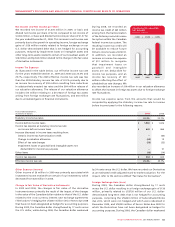
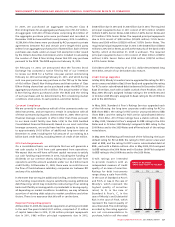
$119$142$176
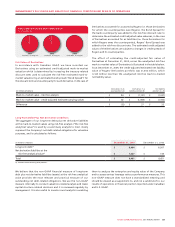
MEDIA ADJUSTED
OPERATING PROFIT
(In millions of dollars)
20092008
2007
200
8
2007
2009
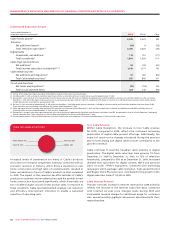
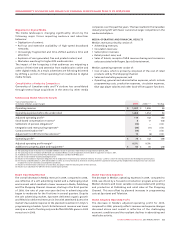
$1,407$1,496$1,317
MEDIA REVENUE
(In millions of dollars)
The challenging economic conditions have resulted in a weakening
of revenue expectations for certain parts of our broadcasting
portfolio. As a result of the challenging conditions and declines in
advertising revenues, we recorded a non-cash impairment charge
of $18 million related to certain of our broadcast assets. See the
section entitled “Impairment Losses on Goodwill, Intangible Assets
and Other Long-Term Assets” for further details.
Media Additions to PP&E
Media’s PP&E additions in 2009 declined from 2008 due to cost
containment initiatives. A significant portion of Media’s additions
reflect the construction of a new television production facility for
the combined Ontario operations of Citytv and OMNI, which was
completed in 2009.
Other Media Developments
In October 2009, the CRTC amended its regulation relating to Part II
fees. These fees going forward will be approximately one-third less
than the historical rate of approximately $6 million annually. For the
three months ended December 31, 2009, the $19 million adjustment
represents the reversal of Part II fees for the period from September
1, 2006 to August 31, 2009. For the year ended December 31, 2009,
the $15 million adjustment represents the reversal of Part II fees
for the period from September 1, 2006 to December 31, 2008. The
remaining $4 million was related to the period from January 1,
2009 to August 31, 2009, and has been recorded as a credit within
adjusted operating profit.
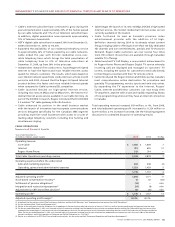
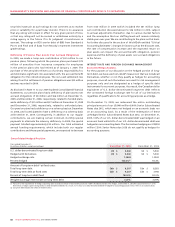
RECONCILIATION OF NET INCOME TO OPERATING
PROFIT AND ADJUSTED OPERATING PROFIT
FOR THE PERIOD
The items listed below represent the consolidated income and
expense amounts that are required to reconcile net income as
defined under Canadian GAAP to the non-GAAP measures operating
profit and adjusted operating profit for the year. See the section
entitled “Supplementary Information: Non-GAAP Calculations”
for a full reconciliation to adjusted operating profit, adjusted
net income and adjusted net income per share. For details
of these amounts on a segment-by-segment basis and for an
understanding of intersegment eliminations on consolidation, the
following section should be read in conjunction with Note 3 to the
2009 Audited Consolidated Financial Statements entitled
“Segmented Information”.
Years ended December 31,
(In millions of dollars) 2009 2008 %Chg
Net income $ 1,478 $ 1,002 48
Income tax expense 502 424 18
Other (income) expense, net (6) (28) (79)
Change in the fair value of derivative instruments 65 (64) n/m
Loss on repayment of long-term debt 7 – n/m
Foreign exchange (gain) loss (136) 99 n/m
Debt issuance costs 11 16 (31)
Interest on long-term debt 647 575 13
Operating income 2,568 2,024 27
Impairment losses on goodwill, intangible assets and
other long-term assets 18 294 (94)
Depreciation and amortization 1,730 1,760 (2)
Operating profit 4,316 4,078 6
Stock-based compensation expense (recovery) (33) (100) (67)
Settlement of pension obligations 30 – n/m
Integration and restructuring expenses 117 51 129
Contract termination fees 19 – n/m
Adjustment for CRTC Part II fees decision (61) 31 n/m
Adjusted operating profit $ 4,388 $ 4,060 8