Rogers 2009 Annual Report Download - page 77
Download and view the complete annual report
Please find page 77 of the 2009 Rogers annual report below. You can navigate through the pages in the report by either clicking on the pages listed below, or by using the keyword search tool below to find specific information within the annual report.-
 1
1 -
2
-
3
-
4
-
5
-
6
-
7
-
8
-
9
-
10
-
11
-
12
-
13
-
14
-
15
-
16
-
17
-
18
-
19
-
20
-
21
-
22
-
23
-
24
-
25
-
26
-
27
-
28
-
29
-
30
-
31
-
32
-
33
-
34
-
35
-
36
-
37
-
38
-
39
-
40
-
41
-
42
-
43
-
44
-
45
-
46
-
47
-
48
-
49
-
50
-
51
-
52
-
53
-
54
-
55
-
56
-
57
-
58
-
59
-
60
-
61
-
62
-
63
-
64
-
65
-
66
-
 67
67 -
 68
68 -
 69
69 -
 70
70 -
 71
71 -
 72
72 -
 73
73 -
 74
74 -
 75
75 -
 76
76 -
 77
77 -
 78
78 -
 79
79 -
 80
80 -
 81
81 -
 82
82 -
 83
83 -
 84
84 -
 85
85 -
 86
86 -
 87
87 -
88
-
89
-
90
-
91
-
92
-
93
-
94
-
95
-
96
-
97
-
98
-
99
-
100
-
101
-
102
-
103
-
104
-
105
-
106
-
107
-
108
-
109
-
110
-
111
-
112
-
113
-
114
-
115
-
116
-
117
-
118
-
119
-
120
-
121
-
122
-
123
-
124
-
125
-
126
-
127
-
128
-
129
-
130
 |
 |

ROGERS COMMUNICATIONS INC. 2009 ANNUAL REPORT 81
MANAGEMENT’S DISCUSSION AND ANALYSIS OF FINANCIAL CONDITION AND RESULTS OF OPERATIONS
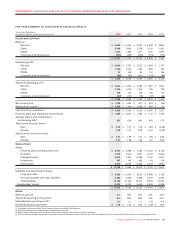
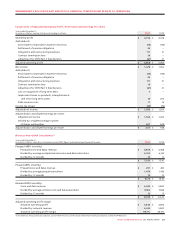
Years ended December 31,
(In millions of dollars, number of shares outstanding in millions) 2009 2008
Operating profit $ 4,316 $ 4,078
Add (deduct):
Stock-based compensation expense (recovery) (33) (100)
Settlement of pension obligations 30 –
Integration and restructuring expenses 117 51
Contract termination fees 19 –
Adjustment for CRTC Part II fees decision (61) 31
Adjusted operating profit $ 4,388 $ 4,060
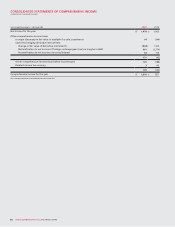
Net income $ 1,478 $ 1,002
Add (deduct):
Stock-based compensation expense (recovery) (33) (100)
Settlement of pension obligations 30 –
Integration and restructuring expenses 117 51
Contract termination fees 19 –
Adjustment for CRTC Part II fees decision (61) 31
Loss on repayment of long-term debt 7 –
Impairment losses on goodwill, intangible assets
and other long-term assets 18 294
Debt issuance costs 11 16
Income tax impact (30) (34)
Adjusted net income $ 1,556 $ 1,260
Adjusted basic and diluted earnings per share:
Adjusted net income $ 1,556 $ 1,260
Divided by: weighted average number
of shares outstanding 621 638
Adjusted basic and diluted earnings per share $ 2.51 $ 1.98
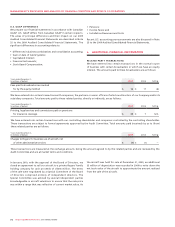
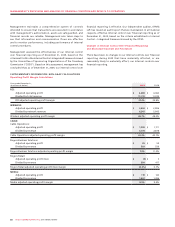
Calculations of Adjusted Operating Profit, Net Income and Earnings Per Share
(1) For definitions of key performance indicators and non-GAAP measures, see the section entitled “Key Performance Indicators and Non-GAAP Measures”.
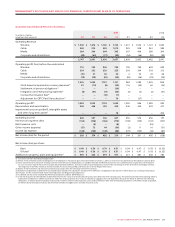
Years ended December 31,
(In millions of dollars, subscribers in thousands, except ARPU figures and adjusted operating profit margin) 2009 2008
Postpaid ARPU (monthly)
Postpaid (voice and data) revenue $ 5,948 $ 5,558
Divided by: average postpaid wireless voice and data subscribers 6,705 6,142
Divided by: 12 months 12 12
$ 73.93 $ 75.41
Prepaid ARPU (monthly)
Prepaid (voice and data) revenue $ 297 $ 285
Divided by: average prepaid subscribers 1,479 1,426
Divided by: 12 months 12 12
$ 16.73 $ 16.65
Blended ARPU (monthly)
Voice and data revenue $ 6,245 $ 5,843
Divided by: average wireless voice and data subscribers 8,184 7,568
Divided by: 12 months 12 12
$ 63.59 $ 64.34
Adjusted operating profit margin
Adjusted operating profit $ 3,042 $ 2,806
Divided by: network revenue 6,245 5,843
Adjusted operating profit margin 48.7% 48.0%
Wireless Non-GAAP Calculations(1)