Rogers 2009 Annual Report Download - page 34
Download and view the complete annual report
Please find page 34 of the 2009 Rogers annual report below. You can navigate through the pages in the report by either clicking on the pages listed below, or by using the keyword search tool below to find specific information within the annual report.-
 1
1 -
2
-
3
-
4
-
5
-
6
-
7
-
8
-
9
-
10
-
11
-
12
-
13
-
14
-
15
-
16
-
17
-
18
-
19
-
20
-
21
-
22
-
23
-
 24
24 -
 25
25 -
 26
26 -
 27
27 -
 28
28 -
 29
29 -
 30
30 -
 31
31 -
 32
32 -
 33
33 -
 34
34 -
 35
35 -
 36
36 -
 37
37 -
 38
38 -
 39
39 -
 40
40 -
 41
41 -
 42
42 -
 43
43 -
 44
44 -
45
-
46
-
47
-
48
-
49
-
50
-
51
-
52
-
53
-
54
-
55
-
56
-
57
-
58
-
59
-
60
-
61
-
62
-
63
-
64
-
65
-
66
-
67
-
68
-
69
-
70
-
71
-
72
-
73
-
74
-
75
-
76
-
77
-
78
-
79
-
80
-
81
-
82
-
83
-
84
-
85
-
86
-
87
-
88
-
89
-
90
-
91
-
92
-
93
-
94
-
95
-
96
-
97
-
98
-
99
-
100
-
101
-
102
-
103
-
104
-
105
-
106
-
107
-
108
-
109
-
110
-
111
-
112
-
113
-
114
-
115
-
116
-
117
-
118
-
119
-
120
-
121
-
122
-
123
-
124
-
125
-
126
-
127
-
128
-
129
-
130
 |
 |

38 ROGERS COMMUNICATIONS INC. 2009 ANNUAL REPORT
MANAGEMENT’S DISCUSSION AND ANALYSIS OF FINANCIAL CONDITION AND RESULTS OF OPERATIONS
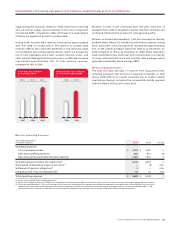
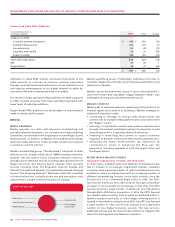
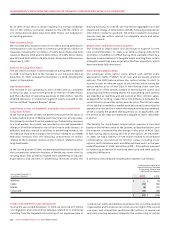
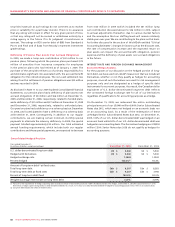
Cable Operations Adjusted Operating Profit
The year-over-year growth in adjusted operating profit was
primarily the result of the revenue growth described above,
combined with decreased activity levels and cost efficiencies.
As a result, Cable Operations adjusted operating profit margins
increased to 42.2% for 2009, compared to 40.7% in 2008.
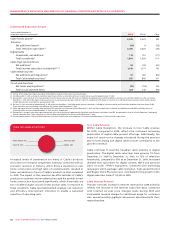
Other Cable Operations Developments
In October 2009, the CRTC amended its regulation relating to Part
II fees. These fees going forward will be approximately one-third
less than the historical rate of approximately $21 million annually.
For the three months ended December 31, 2009, the $60 million
adjustment represents the reversal of Part II fees for the period from
September 1, 2006 to August 31, 2009. For the year ended December
31, 2009, the $46 million adjustment represents the reversal of Part
II fees for the period from September 1, 2006 to December 31, 2008.
The remaining $14 million was related to the period from January
1, 2009 to August 31, 2009, and has been recorded as a credit within
adjusted operating profit.
20092008
2007
2008
2007
2009
1,298
42.2%
40.7%
38.7%
1,1711,008
CABLE OPERATIONS ADJUSTED
OPERATING PROFIT
AND MARGIN (In millions of dollars)
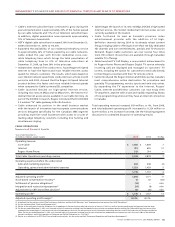
ROGERS BUSINESS SOLUTIONS
Summarized Financial Results
Years ended December 31,
(In millions of dollars, except margin) 2009 2008 %Chg
RBS operating revenue $ 503 $ 526 (4)
Operating expenses before the undernoted
Sales and marketing expenses 26 26 –
Operating, general and administrative expenses 442 441 –
468 467 –
Adjusted operating profit(1) 35 59 (41)
Stock-based compensation recovery (expense)(2) (1) 1 n/m
Integration and restructuring expenses(3) (3) (6) (50)
Operating profit(1) $ 31 $ 54 (43)
Adjusted operating profit margin(1) 7.0% 11.2%
Summarized Subscriber Results
Years ended December 31,
(Subscriber statistics in thousands) 2009 2008 Chg
Local line equivalents(1)
Total local line equivalents 169 197 (28)
Broadband data circuits(2)(3)
Total broadband data circuits 36 34 2
(1) As defined. See the sections entitled “Key Performance Indicators and Non-GAAP Measures” and “Supplementary Information: Non-GAAP Calculations”.
(2) See the section entitled “Stock-based Compensation”.
(3) For the year ended December 31, 2009, costs incurred relate to i) severances resulting from the targeted restructuring of our employee base to combine the Cable and Wireless businesses into a
communications organization; and ii) severances and restructuring expenses related to the outsourcing of certain information technology functions. For the year ended December 31, 2008, costs
incurred relate to i) severances resulting from the restructuring of our employee base to improve our cost structure in light of the current economic conditions and ii) the integration of
Call-Net Enterprises Inc. (“Call-Net”).
(1) Local line equivalents include individual voice lines plus Primary Rate Interfaces (“PRIs”) at a factor of 23 voice lines each.
(2) Broadband data circuits are those customer locations accessed by data networking technologies including DOCSIS, DSL, E10/100/1000, OC 3/12 and DS 1/3.
(3) During the first quarter of 2008, a change in subscriber reporting resulted in the reclassification of approximately 4,000 high-speed Internet subscribers from RBS’ broadband data circuits to
Cable Operations’ high-speed Internet subscriber base. These subscribers are not included in net additions for 2008.